2020 updates
Here are the visible new features or enhancements released in 2020.
December 8
The Service Health tile is now available for all users.
There are no Collection Zone changes in this update.
November 12
This update adds metrics that can be used by the anomaly detection service. The added metrics are for the /Server/SSH/Linux device class.
There are no Collection Zone changes in this update.
November 10
This update includes a new configuration option for Metric + Number tile —you can now choose to display only the most recent data point in the tile, without a chart.
There are no Collection Zone changes in this update.
November 3
With this update, the dashboard scope editor displays approximate entity and device counts. Previously, exact counts were presented.
There are no Collection Zone changes in this update.
October 27
This update includes two refinements to the data point alignment options of the Graph tile.
- The default alignment is changed from
interpolatetomean. - When a collection gap occurs, line charts using the
meanornonealignment option show a straight line across the gap, with no selectable values between the known data points. Other visualization types have the same behavior.
There are no Collection Zone changes in this update.
October 20
This update includes the beta release of a new dashboard tile, the Service Health tile. The Service Health tile displays a table summarizing the health of dynamic services defined in Service Impact.
There are no Collection Zone changes in this update.
October 1
This update includes a new dashboard tile, the Notes tile. You can display plain text and HTML5-encoded content in the tile.
There are no Collection Zone changes in this update.
September 29
The length of time before an inactive user session expires can now be set at 1-60 minutes or 2, 4, or 8 hours. See Managing user sessions.
There are no Collection Zone changes in this update.
September 24
This update includes the beta release of a new feature, dashboard templates. The feature is not available in all Zenoss Cloud environments; for more information, contact your Zenoss representative.
There are no Collection Zone changes in this update.
September 3
With this update, the Single Metric and MultiMetric dashboard tiles are no longer available from the AVAILABLE TILES palette. Existing tiles will continue to work, of course. Please use Graph tiles instead.
There are no Collection Zone changes in this update.
September 1
This update includes a new feature and a fix:
-
Now, users with the Manager role can edit or delete any public dashboard. Previously, only dashboard owners could make changes.
-
Previously, users running an older version of Firefox and using ADFS were unable to log in to Zenoss Cloud.
There are no Collection Zone changes in this update.
August 6
Previously, customers with a single Collection Zone may have experienced very slow performance when a ZenPack included an invalid source. With this update, invalid sources in ZenPacks do not affect performance.
July 23
With this update, you can choose a color for the visualization in Graph tiles that specify both an entity and a metric. When only a metric is specified, visualization color is assigned automatically.
There are no Collection Zone changes in this update.
July 14
This update includes two new features, exporting tile data and exporting dashboards:
- Export individual tile data to a CSV or JSON file. The file includes the data displayed in the tile during the current time range. Supported tiles include the Graph, Metric + Number, Metric Outliers, and Top Event Producers tiles.
- Export a dashboard as a collection of CSV or JSON files bundled in a ZIP archive. The dashboard itself and the tiles that support data export are exported as separate files.
There are no Collection Zone changes in this update.
July 2
Zenoss Cloud includes the following updates:
- The Event Count tile is updated to include a doughnut chart highlighting events by severity levels. Previously, the tile included only the total of all event severities. All existing Event Count tiles are updated with the new charts. The updated tile does not include the Label or Types configuration options.
- The metric dictionary export feature is updated to include the tag field in JSON files.
- The metrics used by the anomaly detection service are updated.
There are no Collection Zone changes in this update.
June 25
The metric dictionary administration page now includes a new feature, the ability to export dictionary entries to local files.
There are no Collection Zone changes in this update.
June 4
The dictionary service now includes 89 additional metric definitions, to support the HP Proliant ZenPack.
There are no Collection Zone changes in this update.
June 2
In the dashboard scope editor, you can now select multiple (including all) sources for removal at once. This simplifies the process of sharing and reusing dashboards.
There are no Collection Zone changes in this update.
May 26
Zenoss Cloud includes the following updates:
- Collection Zone buttons on the Zenoss Cloud home page are now only visible to users with roles that are authorized to access the Collection Zones.
- Dashboards with multiple Metric Outliers tiles now display correct data after a metric in one of the tiles is edited.
There are no Collection Zone changes in this update.
May 19
The Collection Zone button on the Zenoss Cloud home page is now a link to the INFRASTRUCTURE > Devices page.
There are no Collection Zone changes in this update.
May 12
In dashboards, the menu of the Metric + Number tile now includes the metric dictionary option.
There are no Collection Zone changes in this update.
May 7
In dashboards, the Metric + Number tile now supports aggregating the data points of any metric in the dashboard's scope.
OpenCensus export libraries are now available.
There are no Collection Zone changes in this update.
April 28
The metric dictionary editor is updated with simplified text, and the menus that launch it from dashboards and Smart View are simplified, as well.
There are no Collection Zone changes in this update.
April 23
To optimize the display of graphs, the minimum automatic refresh interval for dashboards is updated to 1 minute. Existing dashboards that were configured with lower values have been migrated to 1 minute.
There are no Collection Zone changes in this update.
April 16
This update includes the following dashboard enhancements:
- When you create a scope that includes a Collection Zone, the scope builder displays the count of both entities and devices. Previously, only the entity count was displayed.
- When a dashboard tile takes longer than 30 seconds to load, the tile provides a descriptive message and the dashboard is usable.
There are no Collection Zone changes in this update.
April 14
This update includes two convenient options for changing entries in the metric dictionary, which contains supplemental information about metrics.
You can update information about a metric in context:
- On dashboards, you can open the metric dictionary editor from any dashboard tile that contains a metric.
- In Smart View, you can open the metric dictionary editor from the primary metric tile.
Also, you can update information about any metric from the metric dictionary administration page .
Before this update, changing entries in the metric dictionary required using the metric dictionary service. (Which is still available, of course.)
There are no Collection Zone changes in this update.
April 9
In dashboards, the queries that are used to populate graphs can fail for various reasons. With this update, the messages about those failures are more descriptive.
There are no Collection Zone changes in this update.
April 7
This update includes a new feature, an optional login message. You can create a message that users must acknowledge before completing their login to your Zenoss Cloud environment. For more information, see Login message.
There are no Collection Zone changes in this update.
April 2
This update includes a new dashboard tile, the Graph tile, which allows you to create diagrams of data points from any combination of entities and metrics.
Here are some resources to get you started with the Graph tile:
-
How to create Graph tiles that feature one metric and multiple entities (tutorial): Creating a dashboard for Linux hosts in an organizer
-
How to create a Graph tile for one entity and one metric (tutorial): Creating a Graph tile for a specific entity and metric
-
Just need the fact? Here's the tile's reference page: Graph tile
The new Graph tile is designed to replace the Single Metric and MultiMetric tiles. All three tiles are available in the dashboard editor; we encourage you to use the Graph tile exclusively.
There are no Collection Zone changes in this update.
March 19
In Smart View, Zenoss Cloud arranges related entity tiles from most relevant to least relevant during the time range you are investigating. The arrangement is decided by an AI-calculated score, the ZR INDEX number. The number has been calculated and used since Smart View was released; this update shows the numbers and optionally, a summary. For more information, see ZR INDEX numbers.
There are no Collection Zone changes in this update.
March 12
The dictionary now includes scale factors for selected metrics, which enhance the usability of graphs displayed in dashboards and Smart View. The following metrics are affected:
| Source | Metric | Scale factor |
|---|---|---|
| SNMP |
memAvailReal_memAvailReal | kibibytes * 1024, yielding bytes |
| memAvailSwap_memAvailSwap | ||
| memBuffer_memBuffer | ||
| memCached_memCached | ||
| memoryAvailableKBytes_memoryAvailableKBytes | ||
| batteryRunTimeRemaining_batteryRunTimeRemaining | centiseconds * 0.01, yielding seconds | |
| sysUpTime_sysUpTime | ||
| uptime_sysUpTime | ||
| vSphere | memActive_memActive | kibibytes * 1024, yielding bytes |
| memBalloon_memBalloon | ||
| memConsumed_memConsumed | ||
| memGranted_memGranted | ||
| memOverhead_memOverhead | ||
| AWS | MemoryUtilized_MemoryUtilized | mebibytes * 1048576, yielding bytes |
| MemoryReserved_MemoryReserved | ||
| NetScaler | svcAvgTransactionTime_svcAvgTransactionTime | microseconds * 1000000, yielding seconds |
Also, the dictionary feature of the Zenoss API is updated to support scale factors.
There are no Collection Zone changes in this update.
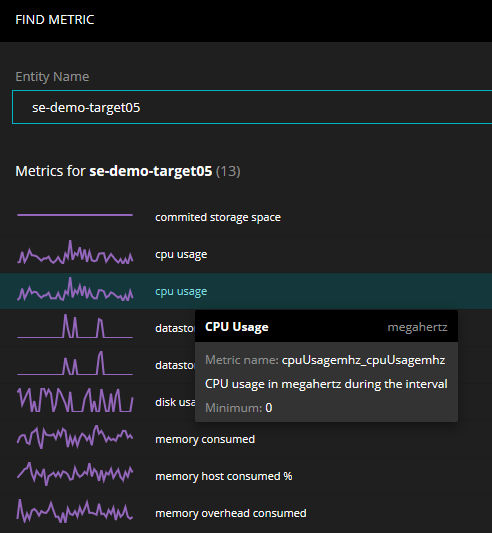
March 3
This update includes an enhancement to
dashboard metric tiles. During configuration of Single Metric
and Metric + Number tiles,
a tooltip displays dictionary
information about metrics, if information is available. The following
image shows an example of the information displayed for the
cpuUsagemhz_cpuUsagemhz metric.
There are no Collection Zone changes in this update.