Event List + Count tile
On the Event List + Count tile, you can view key information about events reported against entities in the dashboard’s scope during the current time range. You can configure this information to display in a donut chart, a table, or both. For example, you can view severity levels of events in a donut chart.
-
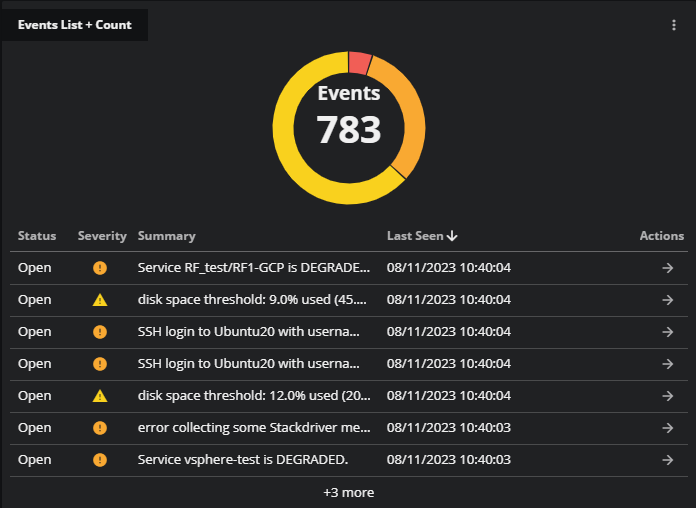
The donut chart shows the total event count and the groups that comprise that count. You can group events by a selected indicator, such as the severity level of events reported against entities in the dashboard's scope during the current time range.
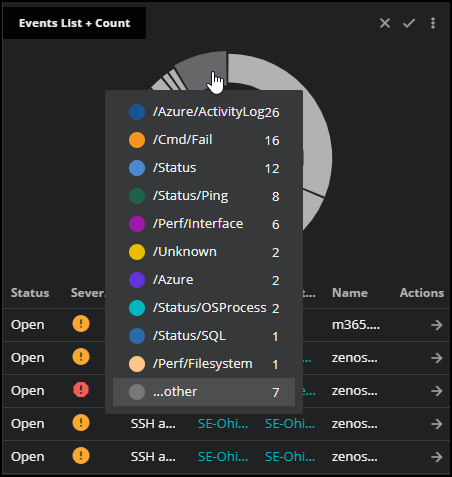
Hover your mouse over the sections in the donut chart to see the represented groups. If you select an indicator that has many groups, such as Entity or Event class, you can view the top ten entities or classes in the donut chart. The remaining items are collapsed into a single group that is color-coded as gray.
-
The table lists the events in the order you specify when configuring the tile. You can also select the arrow in the Actions column to navigate to the Events console to view the associated event in more detail.
Example tile
Configuring the tile
You can set the following options to determine how your tile appears in the dashboard.
- Tile title
- Enter the text that you want to use as the title of this tile. The title appears in the upper-left corner of the tile.
- Group counts by
-
Select the criteria to use for grouping event counts in the donut chart. For example, select Severity to group the events by severity levels such as Warning, Critical, and Error. Hover your mouse over the sections in the donut chart to see the represented groups.
If you select an indicator that has many groups, such as Entity or Event class, you can view the top ten entities or classes in the donut chart. The remaining groups are collapsed together as ...other and are color-coded as gray.
- Show
- Select the view for the tile. You can select Donut, Table, or both. By default, both views are selected.
- Adjust columns
- Select the event fields to include as columns in the table. For example, you may want to select Status, Severity, and Last seen as columns in the table.
- Sort list by
- Select the column that determines the order of the items in the table. For example, you can select to sort by Severity.
- Rows to display
- Select the number of rows to include in the table. If the tile is too small, the number of rows is truncated. You can resize the tile to show more rows.
- Filters
-
Configure one or more comparisons that select events to include in a tile. Events that don't match all comparisons are excluded.
You can specify the following fields in comparisons. If you specify the same field multiple times, the field values are combined.
Field Description Status One or more event statuses (Open, Suppressed, or Closed). Severity One or more event severity levels (Critical, Error, Warning, or Info). Summary Text included in an event summary. Parent entity name The name of an entity's parent entity. Name The name of an event. Last seen Date and time the event was last seen. Entity name The name of an entity associated with an event. Event class The name of a class associated with a event. You can associate class names with an event when you create it and when you map it. Source The instance identifier of a source type, for example, cz0.CZ production state A Collection Zone production state name (Production, PreProduction, Test, Maintenance, or Decommissioned). CZ location The name of the Collection Zone Locations organizer to which an entity associated with an event belongs. CZ groups The name of the Collection Zone Groups organizer to which an entity associated with an event belongs. CZ systems The name of the Collection Zone Systems organizer to which an entity associated with an event belongs. CZ priority The Collection Zone device priority associated with an event (Highest, High, Normal, Low, Lowest, or Trivial). CZ device class The Collection Zone device class associated with an event. CZ incident Include or exclude events that have been opened as incidents in an external workflow system. This field is only relevant if your Collection Zone includes the Incident Management Integration Service ZenPack. - Tile scope filters
-
(Optional) Create a specific filter just for the tile. This is useful if you need to compare different services side-by-side. For example, maybe you want to compare the performance of your services in different regions.
Use the query builder to create and apply a filter to the tile:
-
Click the + (plus sign) to add a clause.
-
To define the clauses, click in the first field to select an entity field. This field offers suggestions based on the user-friendly names in the Dictionary or from live data in your system.
-
Select your operator, then select your value. Start typing in the value field for autosuggestions based on your selected entity field.
-
To add another simple clause or add a compound clause, use the buttons in the top of your query. To remove all the clauses, click the X button in the top of the query.
-