Dictionary service
The dictionary service provides more readable or compact alternatives to computer-generated metric names and field names for entities, events, and metrics. Dictionary entries enhance the usability of Virtana Service Observability wherever metric, entity, and event information is displayed. There are several dicitionary tabs, including the following:
-
Metrics. Metric entries are used in series graphs, which appear in Smart View pages, dashboard tiles, and many other pages. Note that the metrics dictionary entry provides detail and context for a given metric name, while the metric fields dictionary entry describes the fields (or attributes) that accompanied a metric, not the metric itself.
-
Entity fields. Entity field entries provide additional context for fields found on Virtana entities, such as common fields like source and source-type, as well as allowing users to provide additional context on custom fields they may be sending into Virtana. They appear in Inventory.
-
Event fields Event field entries are used in events consoles, dashboard tiles, and Smart View pages. These entries provide additional context for fields found on events.
-
Metric fields. Metric field entries are used in dashboard tiles and actions, particularly graph tiles, and trigger criteria. Metric field names are useful when you are collecting telemetry data, such as metrics and their metadata, in Virtana from sources other than collection zones, such as OpenTelemetry collectors or APIs. You can create dictionary entries for these metadata attributes so your organization can more easily identify them in graph tiles and trigger queries.
Virtana Service Observability looks for dictionary entries by default. However, you may have custom metric, entity, or event sources that are not included in the default dictionary, or you may wish to customize the default information. Any user can edit a dictionary entry on a dashboard or Smart View page. Users with the Manager role can add and manage entries on the dictionary administration page.
Default and effective entries
Initially, the default entry for a metric, entity, or event field is your organization's effective entry. The default entry is the entry provided by Virtana. An effective entry is the working entry that you want to use in Virtana Service Observability.
When you customize a default entry, your customized entry overrides the default entry and becomes the effective entry. Likewise, when you create a new entry for a metric, entity, or event field that has no default, your new entry becomes the effective entry for your organization.
You can revert your customization of an entry to the Virtana default at any time and update your unique entries at any time, too.
Opening the dictionary service
You can examine the dictionary entries from the following locations:
-
The Virtana Service Observability header is visible on all tabs. In the header, click ADMIN, then Dictionary.
-
In Smart View, in the top-right corner of the primary metric card, click the vertical ellipsis (⋮). On the menu that opens, click Metric Dictionary.
-
In a dashboard, in the metric tile header, click the vertical ellipsis (⋮). On the menu that opens, click Metric Dictionary.
Note
Your account must be assigned the User role or higher to edit individual metric dictionary entries. To manage dictionary entries, your account must be assigned the Manager role. For more information, see Roles and permissions.
Tour of the dictionary service
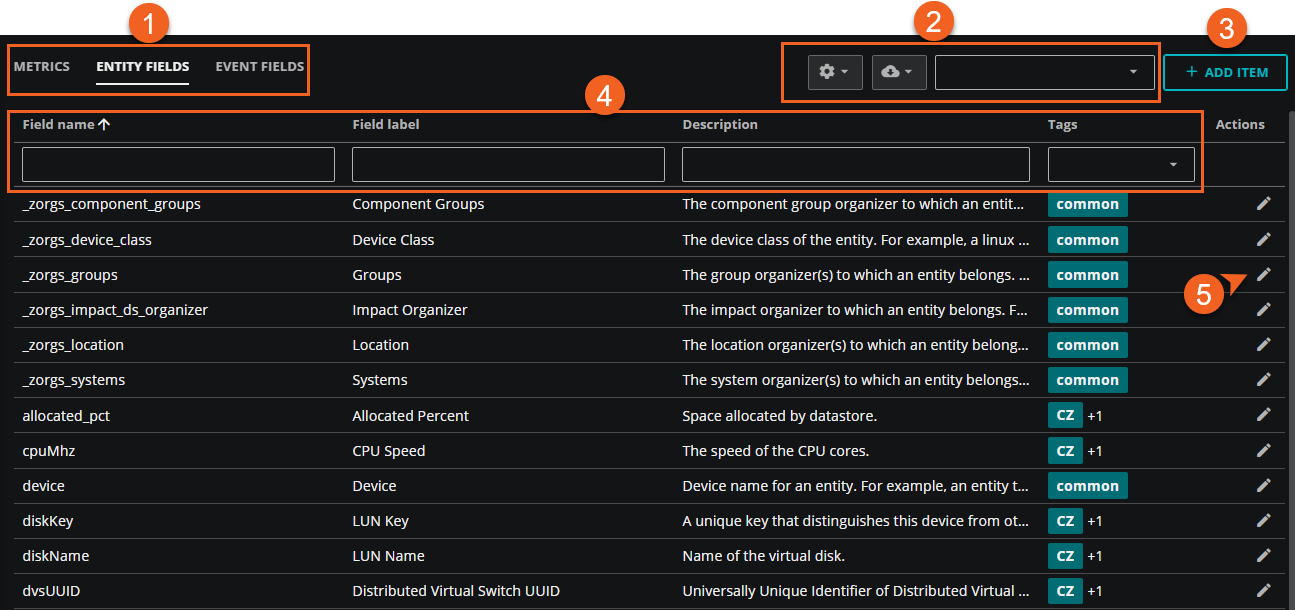
The dictionary service features threee tabs for metrics, entity fields, and events fields. For each tab, the entries appear in a table that you can filter, sort, and export.
| Item | Feature | Description |
|---|---|---|
| 1 | Tabs | Select a tab to view the dictionary entries. You can choose METRICS, ENTITY FIELDS, EVENT FIELDS, or METRIC FIELDS. When you select a tab, the table shows the entries for the selected dictionary. |
| 2 | Configuration options | Use these controls to manage the entries. Settings (gear icon) offers options to clear filters, adjust columns, and restore defaults. Use the Export table icon to download the entries in a selected format. You can also globally filter entries. |
| 3 | Add an entry | Click ADD ITEM to open a dialog box for adding an entry. See Adding and editing dictionary entries for more information. |
| 4 | Column filters | To filter entries, enter your search terms in the box at the top of the column. |
| 5 | Entry actions | Select the pencil icon in the entry row to edit that entry. For metrics, click the vertical ellipse (⋮) to add the metric to a dashboard. |
Managing dictionary entries
Users assigned the Manager role can manage dictionary entries on the ADMIN > Dictionary page. Let's take a closer look at the management tools available in dictionary service.
- Configure rows per page
-
To configure the rows per page and navigate the pages, use the controls on the bottom-right side of the page.
- Filter entries
-
To filter entries, enter search terms in the box at the top of a column. For example, if you enter "group" in Metric label, only entries that have the word "group" in the label appear.
- Filter entries globally
-
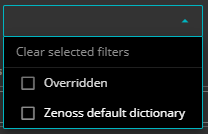
To filter entries globally, select the types of entries to display. You can filter by Overriden and Virtana default dictionary.
Overridden entries include definitions you create, whether a Virtana default exists or not.
- Edit entries
- To edit an entry, click the pencil icon in the Actions column. The Edit dialog box opens.
- Export dictionary
-
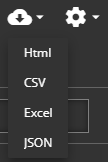
To download the contents of your effective dictionary, select a format from the export menu, such as CSV or JSON.
The export includes everything in the dictionary, regardless of filter settings.
- Manage customized entries
-
When a dictionary entry includes both a Virtana default definition and a customized definition, the row includes an expand/collapse control to the left of the entry.
Expand the entry to display the customized definition and the Virtana default definition.
When you have a customized definition, you can also delete it. In the Actions column, select Delete (trash can icon) to remove the customized definition and revert to the Virtana default entry.
Adding and editing dictionary entries
You can add new entries to your dictionary and edit existing entries. To learn more, see Adding and editing dictionary entries
Dictionary contents
As a reference, you can view the fields for metric, entity, and event entries.
Metrics
Each entry for a metric can include an alternative for the metric's name and additional, contextual information. All fields except the name are optional.
| Field | Description |
|---|---|
| Metric name | The metric name (required). |
| Metric label | A display name for a metric. |
| Description | A longer, free-form statement about a metric. |
| Units | The unit of measurement the metric represents, for example, GB, IOPs, or percent. This value is the label for the vertical axis of a metric's graph. |
| Is rate metric | Define this metric as a rate metric, so it appears as a rate throughout the system. This is useful for some metrics like OpenTelemetry's system.cpu.time which is a counter and not a point-in-time measurement. It is best viewed as a rate (value/time-since-last-value). By default, this setting is turned off. |
| Conversion | The conversion to use to normalize data points, for example, convert milliseconds seconds. |
| Scale factor | A custom conversion to use when the Conversion field doesn't include the conversion you need. |
| Minimum value | A minimum value for data points to adjust the metric's graph. Data points are never discarded. |
| Maximum value | A maximum value for data points to adjust the metric's graph. Data points are never discarded. |
| Tags | A list of terms to associate with a metric or event field. The tags namespace is shared among all dictionary types. |
Entity, Event, and Metric fields
Entity, event, and metric field entries are simpler than entries for metrics.
| Field | Description |
|---|---|
| Field name | The entity, event, or metric field name (required). |
| Field label | A display name for an entity, event, or metric field. |
| Field type | Type of field for the entity, event, or metric field (required). Use the dropdown list to select the field type, such as Boolean, String, or Autosuggest. |
| Description | Description or explanation about an entity, event, or metric field. |
| Tags | A list of terms to associate with the entity, event, or metric field. The tags namespace is shared among all dictionary types. |
Source information
The default dictionary entries supplied by Virtana include tags that identify the source of an event field or metric.
For example, event fields that originate in the Capacity ZenPack include the CZ and capacity tags. Likewise, metrics that originate in the host-network-interface datasource of Virtana Data Monitor include the host-network-interface and ZDM tags.
Dictionary service API
You can view the Virtana Service Observability API for dictionary service. You can override default dictionary entries with your own definitions, creating new entries for metrics not included in the default dictionary, and managing custom entries.
For details, see Dictionary service API.


