Create a dashboard for Linux hosts in an organizer
This tutorial shows how to create a dashboard dedicated to the Linux hosts found in a Collection Zone organizer. If you have not already created any organizers, use the procedures on this page to create at least one, and then come back.
In this tutorial, all the hosts are virtual machines running on the same vSphere hypervisor host. It's OK if your hosts are not virtual machines, but they do need to be Linux hosts.
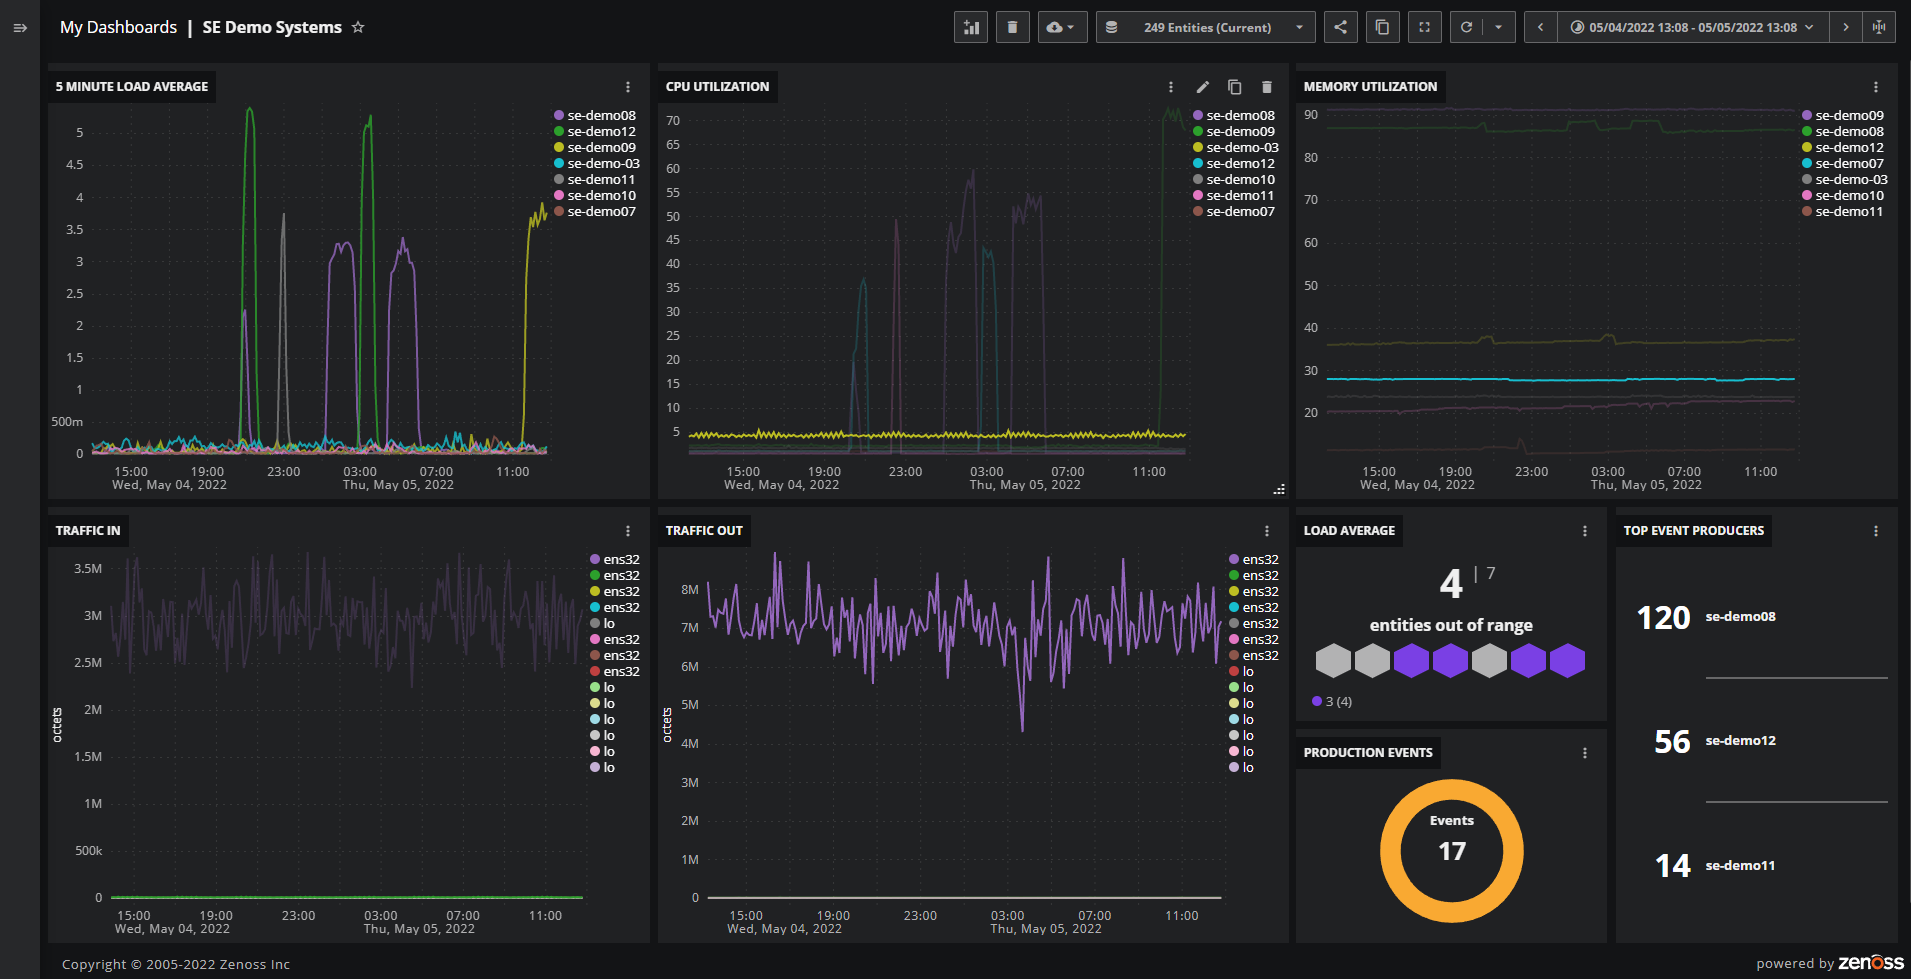
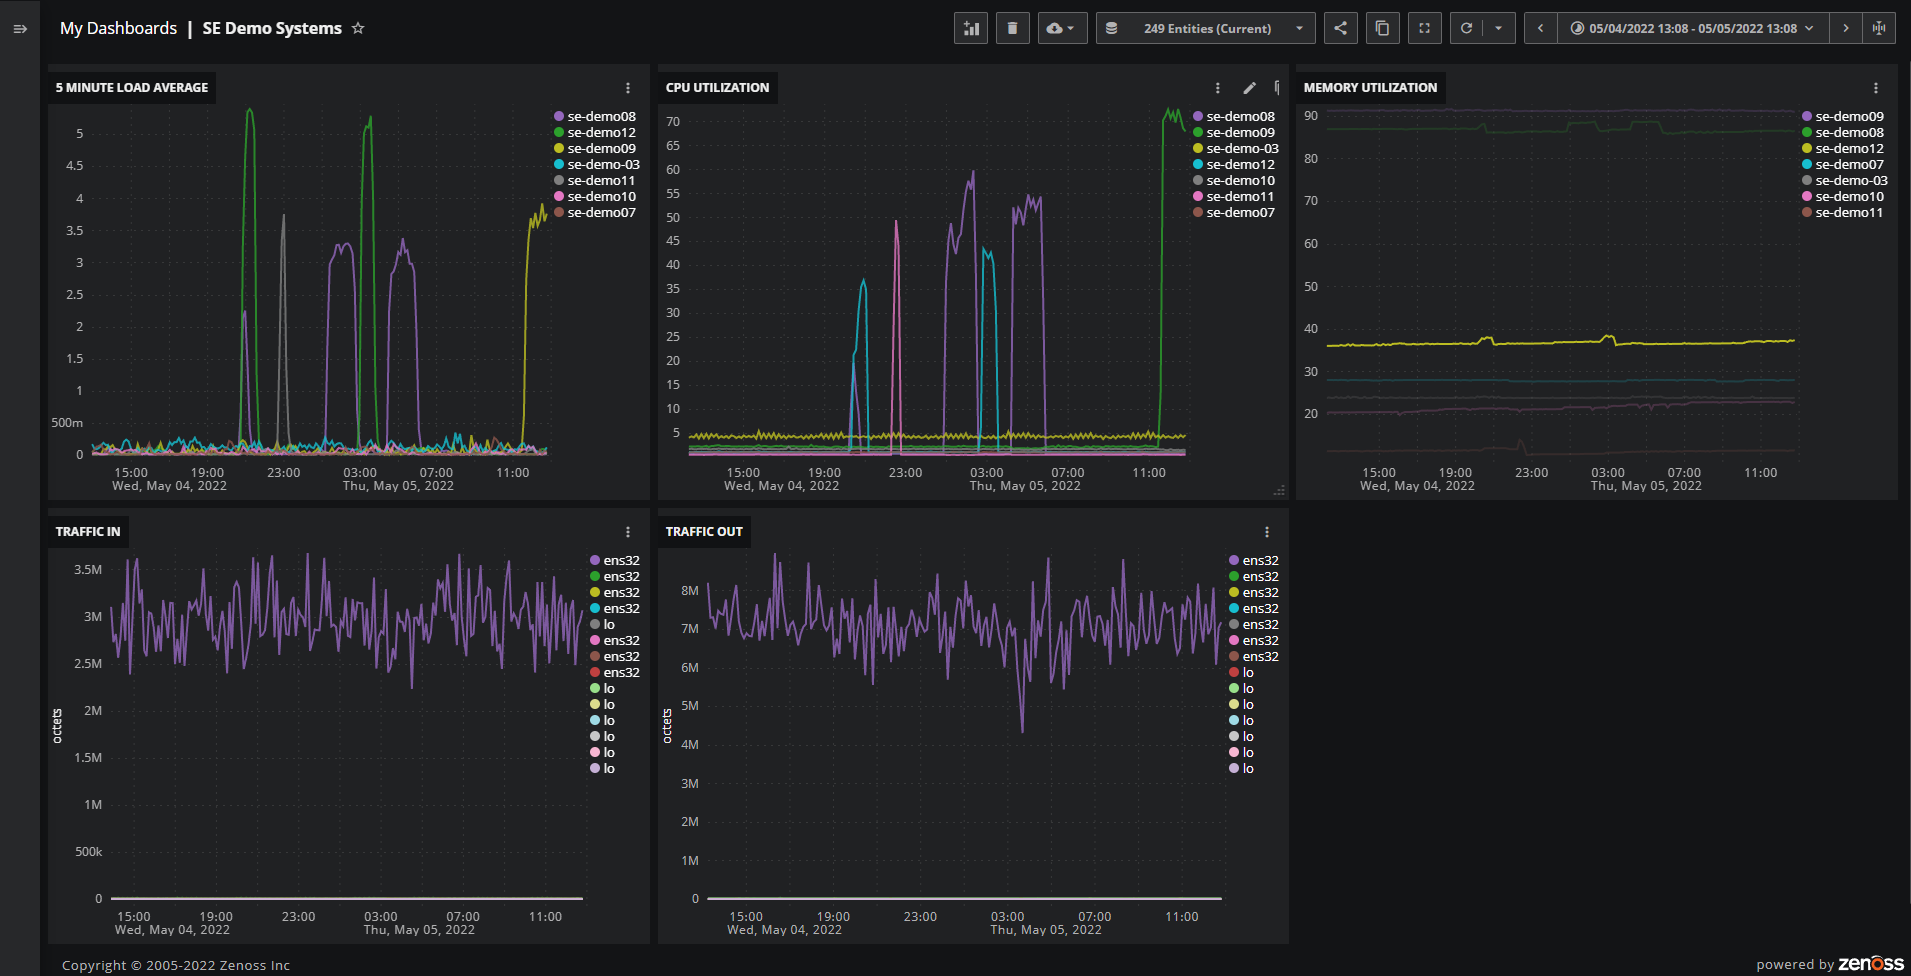
The following example shows the result of this tutorial.
Define the dashboard name and scope
-
In the header, click DASHBOARDS.
-
If you don't own any dashboards yet, an empty page opens. Click CREATE A NEW DASHBOARD.
-
If you do own one or more dashboards, the first dashboard in your list opens.
-
Click the dashboards menu button, and then click NEW DASHBOARD. The Define Dashboard Scope page opens.

-
-
In the name field (upper-left), replace My Dashboard with a descriptive name.
This tutorial uses
SE Demo Systems. Use a name that works for you. -
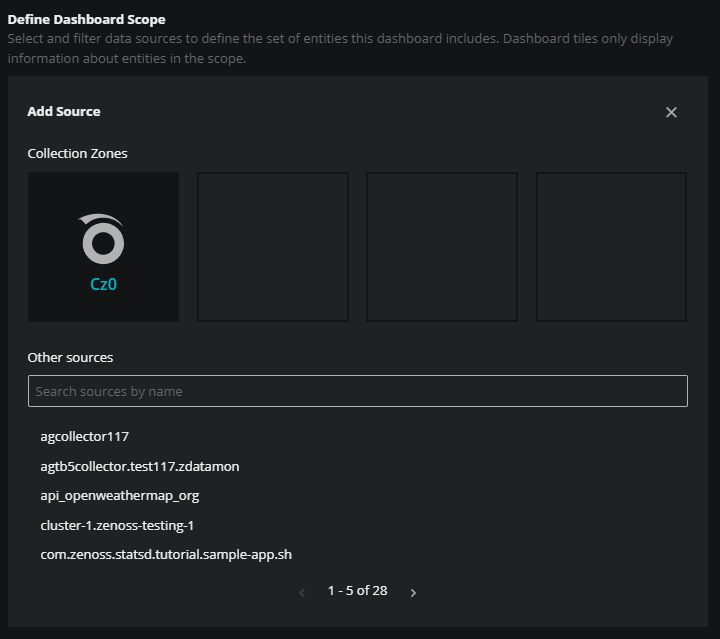
Click ADD ENTITIES.
-
In the Add Source area, click the name of a Collection Zone that includes an organizer. Most customers have just one Collection Zone. Here, the Collection Zone name is Cz0.
When you select a Collection Zone, the page expands to display filtering options.
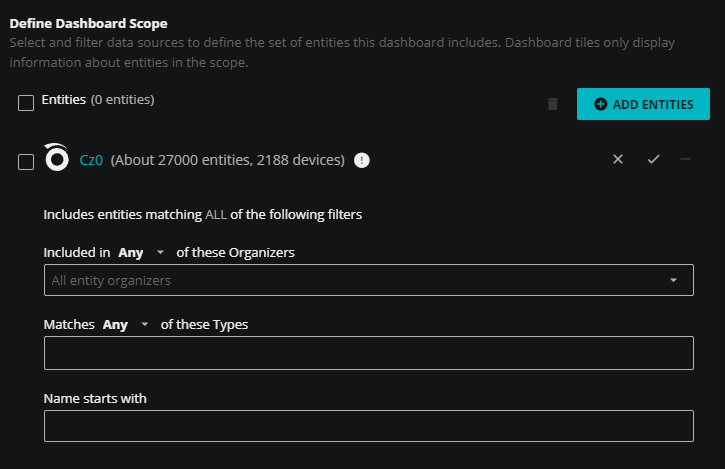
Virtana recommends using one or more filters in all Collection Zone scopes. In this example, we'll walk through adding an organizer filter.
-
Click the "Included in ANY of these Organizers field.
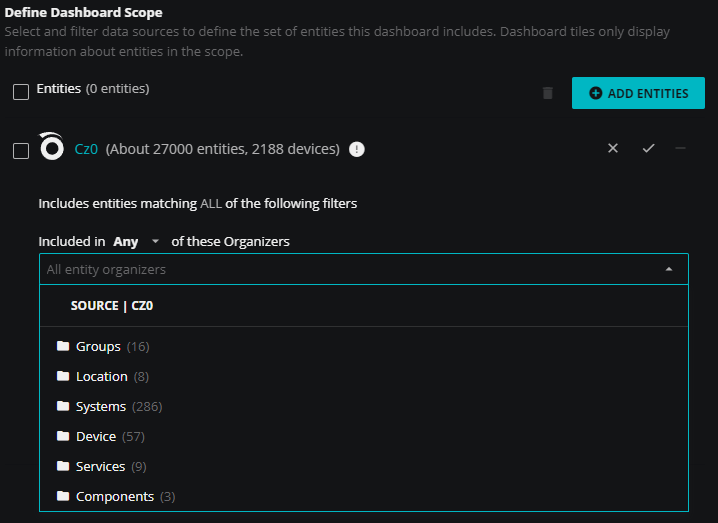
The field displays the organizers in your Collection Zone.
-
Click the name of the organizer that contains the Linux hosts to include in this dashboard.
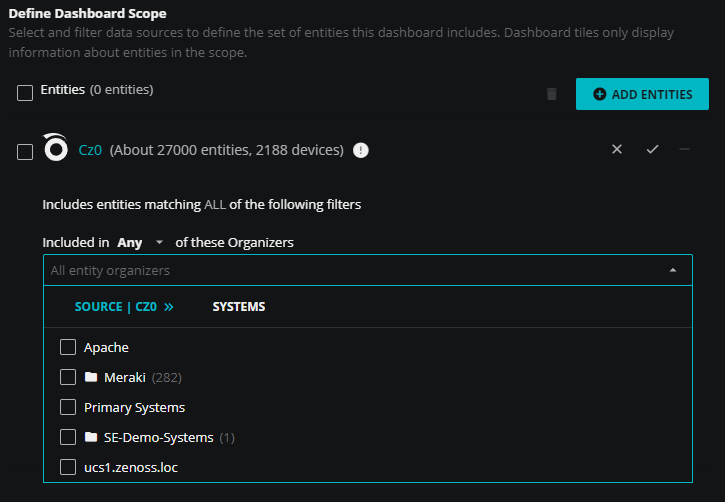
The list updates to display the names of the entities and folders included in the organizer.
-
Continue opening folders, if necessary, and then click the name of the organizer that contains the Linux hosts to include in this dashboard.
This tutorial uses the SE-Demo-Systems organizer.
-
Collapse the list of organizers by clicking outside the Included in ANY of these Organizers field.
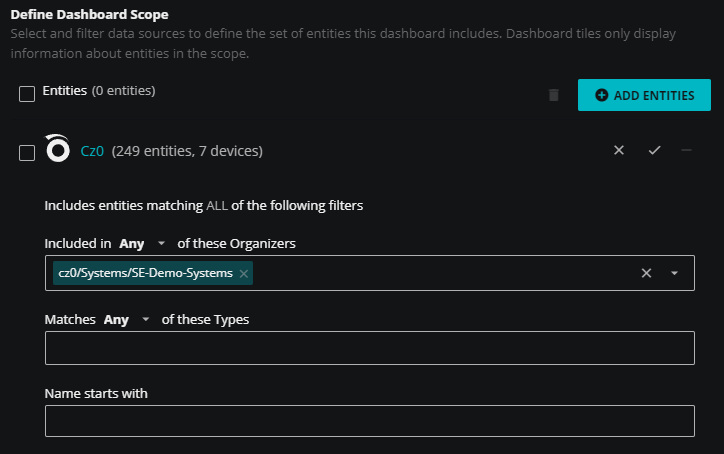
-
Click the check mark icon, immediately below the ADD ENTITIES button.
The filtering options collapse. This allows you to add multiple sources, if desired, and to customize filtering for each source.
-
-
(Optional) To apply filters to the scope, click ADD FILTERS.
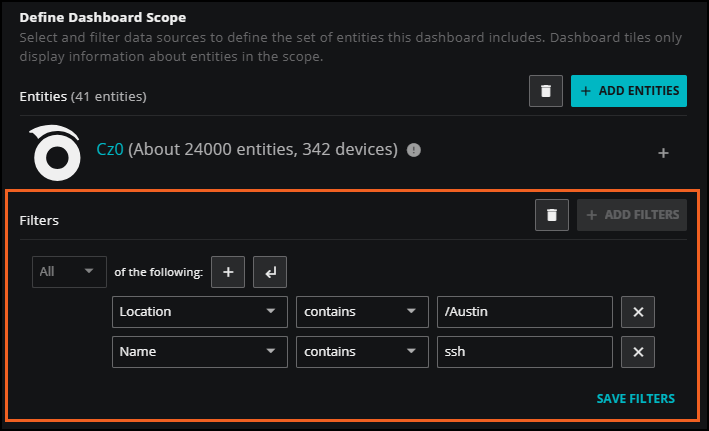
-
To define the clauses, click in the first field to select an entity field. This field offers suggestions based on the user-friendly names in the Dictionary or from live data in your system. The suggestions are in alphabetical order for quicker browsing.
-
Select your operator, then select your value. Start typing in the value field for autosuggestions based on your selected entity field.
-
To add another simple clause or add a compound clause, use the buttons in the top of your query. To remove a clause, click the X button next to the clause.
-
When finished, click SAVE FILTERS to apply your filter to the scope or click the trashcan icon to delete the filter.
-
-
When finished defining your scope, click SAVE in the upper-right corner to return to Dashboards.
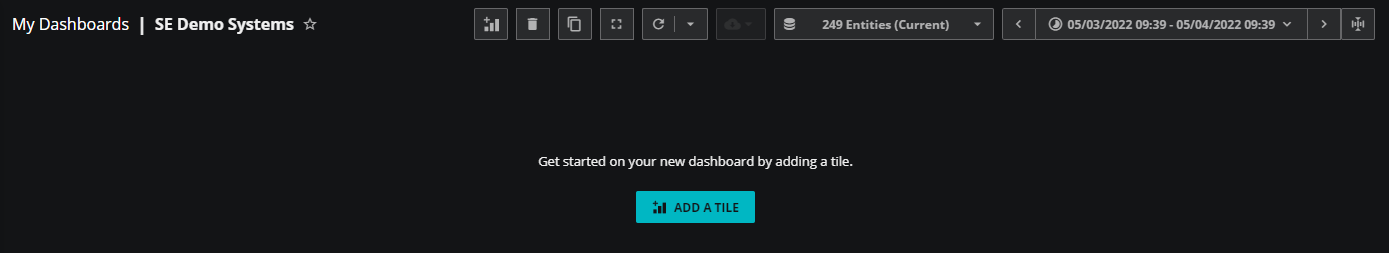
Continue to the next section.
Create Graph tiles
To create a Graph tile, you need to know the name of the metric to display. Metric names are often obscure, so this tutorial supplies the names. Otherwise, you can use the metric dictionary to find metric names. Just open the Smart View page of an entity that collects the metric you want to include in a tile, identify the metric, and then open the metric dictionary editor. This procedure is demonstrated in the Graph tile tutorial.
Create a tile for the 5-minute load average
The first tile shows the 5-minute load average of each host in the dashboard's scope.
-
In the dashboard header, click the add tile control.
-
In the AVAILABLE TILES palette, click the Graph tile icon.

The TILE CONFIGURATION dialog replaces the dashboard editor window with the Graph tile configuration tabs and fields. (For more information about configuring a Graph tile, see the Graph tile reference page.)

-
In the Tile title field, enter
5 Minute Load Average. -
In the Please select a metric area, specify the metric to display.
-
In the Entity and metric field, enter
upti, and then select uptime_laLoadInt5 from the list.The dialog updates to highlight your selection, immediately below the Entity and metric field, and to display a graph. By default, the graph is a line graph that aggregates data points from all the entities in scope that collect the uptime_laLoadInt5 metric.

-
In the Aggregator field, select none.
The dialog updates to show separate line graphs for each entity in scope. When you move your pointer over the over graph, a popup displays the entity and metric names and the data points.
-
From the list in the Label format field, select Entity name.
Since this tile will only display one metric, including the metric name is unnecessary.
-
-
Add a legend to the tile.
-
Near the top-left of the dialog, click the CHART OPTIONS tab.
-
From the Legend position list, select right.
The graph updates to include a legend of entity names. Each name is a link to the entity's Smart View page.
-
-
In the upper-right corner of the dialog, click SAVE.
New tiles are placed in the first available area, starting in the upper-left corner of the dashboard. Don't worry about the size or placement of the tile right now.
Create additional tiles
Create additional Graph tiles as specified in the following tabs. You will resize and rearrange all the tiles in the next section.
| Tile title | CPU Utilization |
| Entity and metric | cpu_ssCpuUsedPerCpu |
| Aggregator | none |
| Label format | Entity name |
| Legend position | right |
| Tile title | Memory Utilization |
| Entity and metric | mem_MemUsedPercent |
| Aggregator | none |
| Label format | Entity name |
| Legend position | right |
| Tile title | Traffic In |
| Entity and metric | intf_ifInOctets |
| Aggregator | none |
| Label format | Entity name |
| Legend position | right |
| Tile title | Traffic Out |
| Entity and metric | intf_ifOutOctets |
| Aggregator | none |
| Label format | Entity name |
| Legend position | right |
Resize and arrange tiles
Now, resize and move all the Graph tiles.
-
The resize control appears in the bottom-right corner of the tile when you move your mouse anywhere over the tile.
-
The move control appears when you hover over the header area of the tile.
The following image shows a suggested arrangement of the tiles.
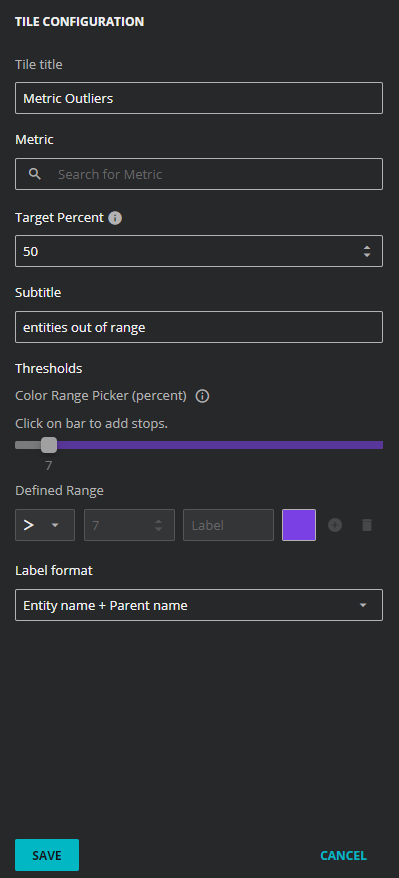
Create a Metric Outliers tile
This dashboard already includes line graphs of 5-minute load averages, but there's a tile that you can use to highlight entities with data points that exceed a threshold, the Metric Outliers tile.
-
In the dashboard header, click the add tile control.
-
On the AVAILABLE TILES palette, click the Metric Outliers icon.
-
In the TILE CONFIGURATION dialog, configure the tile:
-
In the Tile title field, replace Metric Outliers with
Load Average. -
In the Metric field, enter
upti, and then select uptime_laLoadInt5 from the list. -
In the Target Percent field, replace 50 with 1.
This means that data points must satisfy the threshold criteria 1% of the dashboard's time range.
-
Leave the Subtitle and Thresholds fields unchanged.
-
In the Defined Range area, reduce the value from 7 to 3.
-
Leave the Label format field unchanged.
-
-
At the bottom, click SAVE.
The Metric Outliers tile uses hexagons to represent entities and arranges entities in alphabetical order. Entities that exceed the specified thresholds show up in the color associated with the threshold.
Create events tiles
Two tiles summarizing events round out the dashboard, one showing event totals and another identifying the entities that are producing the greatest numbers of events.
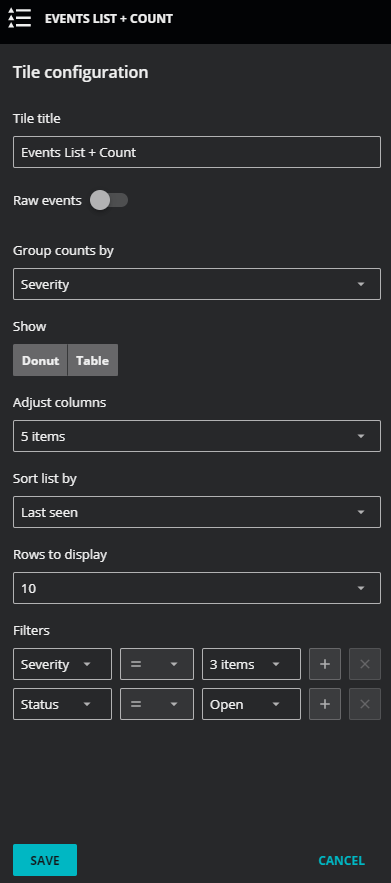
Create an Event List + Count tile
The Event List + Count tile displays information about events reported against entities in the dashboard's scope in a doughnut chart, a table, or both. For this dashboard, you'll create a doughnut chart to show the count of critical and error events.
-
In the dashboard header, click the add tile control.
-
On the AVAILABLE TILES palette, click the Event List + Count icon.
-
In the TILE CONFIGURATION dialog, configure the tile:
-
In the Tile title field, enter
Production Events. -
In the Show area, click Table to deselect it.
-
In the Filters field, click the 3 items list, and then click Warning to deselect it.
Leave all the other options unchanged.
-
-
Click SAVE.
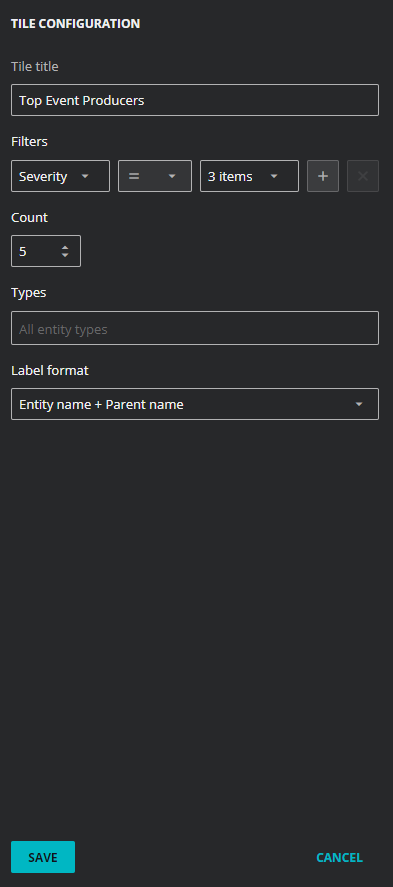
Create a Top Event Producers tile
The Top Event Producers tile displays the count of events and the names of the entities that have the greatest number of events reported against them.
-
In the dashboard header, click the add tile control.
-
On the AVAILABLE TILES palette, click the Top Event Producers icon.
-
In the TILE CONFIGURATION dialog, configure the tile:
-
Leave the Tile title field unchanged.
-
In the Filters field, click the 3 items list, and then click Warning to deselect it.
-
Leave the Count and Types fields unchanged.
-
In the Label format field, select Entity name.
-
-
Click SAVE.
Congratulations, you're done! Compare your dashboard with the example at the beginning of this tutorial, if you wish.