About streaming data
Virtana Service Observability provides several methods for gathering model, metric, and event data without a Collection Zone. Each method uses the data receiver resources of the Virtana Service Observability API to update Virtana Service Observability. Updates are either a single transaction or a regular flow of data, or streaming data.
Data collection methods include:
-
ZenPacks. Learn more.
-
Connectors. A connector gathers data from public cloud applications with just a little configuration.
-
Agents. An independent agent sends data either directly to Virtana Service Observability or indirectly through a proxy. Agents are distributed as Docker images or platform-native packages.
-
Integrations. You can create customized applications with data receiver resources or with existing Virtana libraries.
All your streaming data flows can be customized with the policy service, which allows you to define, manage, and enforce policies that control access to your resources. For more information, see Policy service.
You can also use Virtana Service Observability with OpenTelemetry to collect, process, and export telemetry data, including metrics. To learn more, see OpenTelemetry.
Connectors
Virtana Service Observability provides ready-made connectors for public cloud applications. To enable monitoring, you need only configure a few fields—no agent installation is required. Supported connectors include:
- Microsoft 365 supports Microsoft Teams, Microsoft OneDrive, Microsoft Exchange, and Microsoft SharePoint.
- Site Availability Monitor supports monitoring the uptime of your cloud-based web applications.
- Zoom supports the Zoom platform.
- Kubernetes supports clusters on AWS, Azure, and Google Cloud, as well as self-hosted clusters.
Before setting up your connectors
Depending on your setup, you might need to know the source IP address from which to expect connections. For example, if your connector is monitoring services behind a firewall, then you might want to configure those services to allow access from the source IP address. These source IP addresses are critical for your Kubernetes and Site Availability Monitoring connectors, but can help when troubleshooting Microsoft and Zoom connection issues as well.
Therefore, you might want to add the following IP addresses to your IP allowlist. If needed, check with your Virtana support associate to identify your Virtana region.
| Environment | Google Cloud Region | IP Address |
|---|---|---|
| US Production (Central) | us-central1 | 34.69.219.244 |
| US Production (West) | us-west4 | 34.125.204.146 |
| Europe Production (Frankfurt) | europe-west3 | 35.246.162.90 |
| Australia Production & Development/Staging | australia-southeast1 | 34.87.243.148 |
| Development/Staging (non-Australian) | us-central1 | 35.232.100.200 |
Viewing connectors
You can examine connectors from the following location:
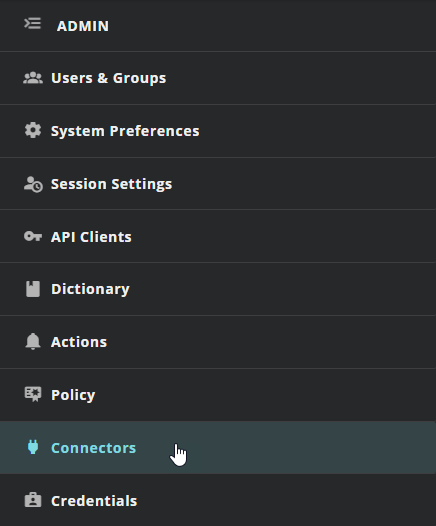
- The Virtana Service Observability header is visible on all tabs. In the header, click ADMIN, then Connectors.
Note
Your account must be assigned the Manager role to create and manage connectors.
After you open Connectors, you can view your active connectors in the table.
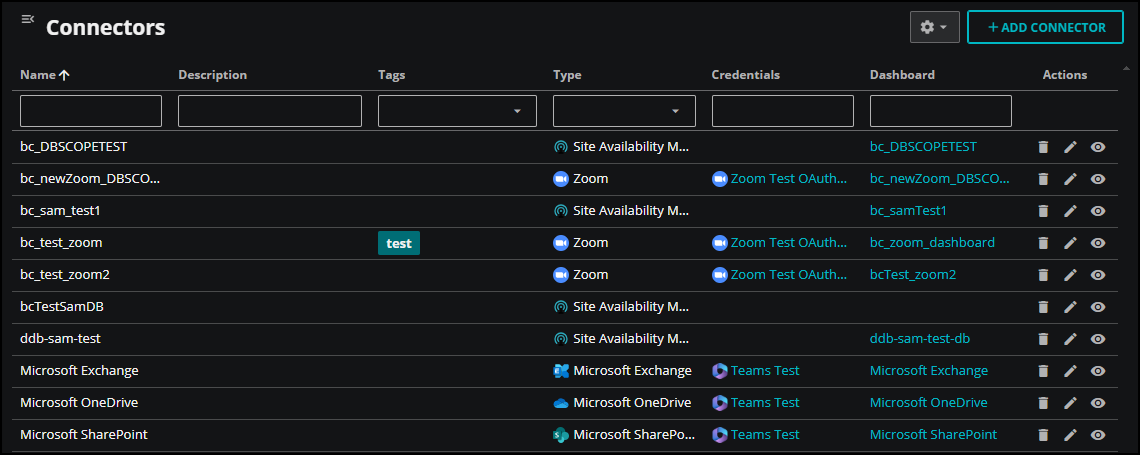
There are several actions you can take when viewing and searching connectors:
View connector details
To view additional information about a connector in the table, click Connector details (eye icon) in the Actions column for the row. In the details panel that opens, you can view more information, such as connector type, credentials, and dashboard locations.
A connector might be associated with multiple credentials, for example, a Site Availability Monitoring connector might be configured for multiple sites, each with unique credentials. In such cases, the Credentials column displays the link text multiple credentials for that connector. Click the link to open the Credentials service so you can view a filtered table of the associated credentials.
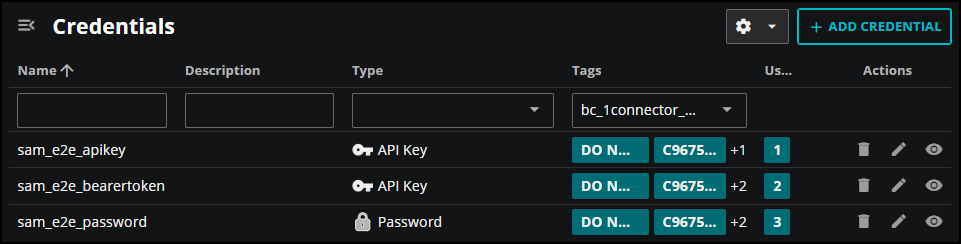
Credentials are only filtered for connectors created or edited after December 19th, 2024.
Hide or reorder columns
You can change how the properties appear in the table. To make changes, click Settings (gear icon), and then click Adjust columns in the menu. In the ADJUST COLUMNS dialog box that opens, you can select or clear the available columns, and change the order of the columns in the table.
To revert back to the initial layout, click Settings and then click Restore defaults.
Filter by column
If you have a lot of connectors to view, you can filter them by column.
- To filter the connectors in the table, enter filter text in the column header. For example, if you want to view just your Kubernetes connectors, click in the Type column and select Kubernetes.
To remove filters from all columns, click Settings, then click Clear filters.
Sort rows
If you have a lot of connectors to view, you can use the additional sorting options in the column. Click the menu next to the column name and do any of the following actions:
-
Sort the rows in ascending or descending alphabetical order, or clear any previously applied sort options.
-
Autosize the specified column or all the columns in the table, or choose to autosize all the column contents, but not the header.
Adding connectors
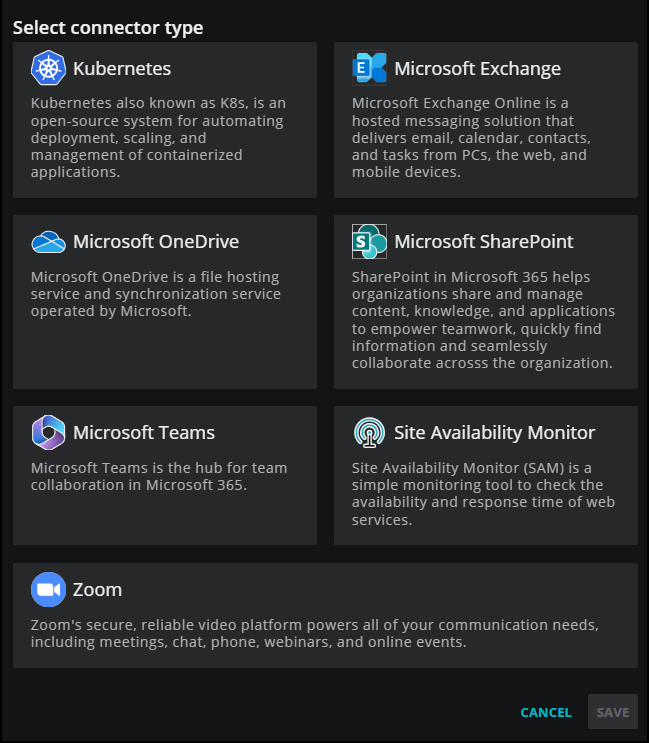
You can add connectors for Kubernetes clusters, Microsoft 365 applications, Site Availability Monior, and Zoom. To get started, click ADD CONNECTOR in Connectors, then select your connector type.
To learn more about adding a specific connector, see the following articles:
- Set up a Kubernetes connector
- Set up a Microsoft 365 connector
- Set up a Site Availability Monitor connector
- Set up a Zoom connector
Agents
An agent is software that runs on your hosts. It collects events and metrics from hosts and sends them to Virtana Service Observability where you can analyze your monitoring and performance data. Agents are distributed either as Docker images or as platform-native packages.
Virtana provides the following purpose-built clients, which stream data to Virtana Service Observability through a standard HTTPS connection:
- Virtana Service Observability agent on Kubernetes
- Virtana Service Observability agent on Linux
- Virtana Service Observability agent on Windows
Virtana Service Observability agent on Linux
The Linux agent is a modular monitoring service that collects data from Linux hosts and streams the data directly to Virtana Service Observability. The service supports non-interactive installation, so you can easily automate its distribution to hosts throughout your environment.
You can install the service agent on a real or virtural Linux host that uses either the Debian or the Red Hat package management system.
- Install the Virtana Service Observability agent on Debian-based Linux hosts
- Install the Virtana Service Observability agent on Red Hat-based Linux hosts
- Manage the Virtana Service Observability agent on Linux
Linux service datasources
After installation, you can configure and manage the Virtana Service Observability agent and collect metrics for your Linux hosts.
- host-cpu
- host-disk
- host-filesystem
- host-linux-device
- host-linux-lvm
- host-linux-service
- host-network-interface
- host-process
- http
- icmp
Virtana Service Observability Site Availability Monitor collector
If you want to monitor both external and internal sites and endpoints, then you might want to configure the Site Availability Monitor (SAM) collector. The SAM collector monitors the availability of internal sites, such as servers, network devices, and applications, from within your firewall.
To use the SAM collector, install the Linux agent and configure the http datasource.
If you choose to enable the http datasource during installation, a default configuration file is placed in the /etc/zendatamon-configs directory.
Optionally, you can manually create the file and add it to this location later.
To manage the configuration, edit the YAML file associated with the datasource.
After configuration, you can collect metrics for your SAM sites.
Virtana Service Observability agent on Windows
The Windows agent is a modular monitoring service that collects data from Windows hosts and streams the data directly to Virtana Service Observability. The service supports non-interactive installation, so you can easily automate its distribution to hosts throughout your environment.
You can install and configure the service agent to collect data from your Windows hosts and stream the data directly to Virtana Service Observability.
- Install Virtana Service Observability agent on Windows
- Manage Virtana Service Observability agent on Windows
Windows service metrics
After installation, you can collect metrics for your Windows hosts.
Virtana Service Observability agent on Kubernetes
The Virtana Service Observability agent on Kubernetes is a monitoring program that runs as a background process. It collects key cluster metrics from kube-apiserver and then streams them directly to Virtana Service Observability. The agent sends both metric and model data for pods, containers, nodes, namespaces, and the cluster itself. The metric data can be viewed in dashboards or in Smart View. A Kubernetes dashboard template is available. The model data includes dependency relationships, which enable Smart View analyses of related cluster entities.
The Virtana Service Observability agent on Kubernetes requires metrics-server. You include the agent in a cluster with a deployment and Kubernetes schedules the agent in its own pod, on one node. The size of a cluster determines how much RAM the agent consumes; in small clusters, it consumes approximately 15MB. The agent uses incremental change notifications to collect data, rather than a polling interval, and so receives updates any time a monitored property changes. The agent sends a batch of metric data to Virtana Service Observability every 60 seconds and sends a batch of model data when the model data changes. The source code of the agent is public and an image containing its binary is available on Docker Hub.
To learn more about installing the Virtana Service Observability agent on Kubernetes and the metrics you can collect, see Virtana Service Observability Clound agent on Kubernetes.
Integrations
You can create customized applications with data receiver resources or with existing Virtana libraries. Use the Virtana Service Observability API to configure the resources of the data receiver service to send entities, metric data points, and events directly to Virtana Service Observability.
Policy service
The policy service provides centralized data and operations management through declarations rather than code.
-
Transform incoming data with ingest policies.
Separate metadata from data in incoming metric data streams to create distinct entities and metrics, without writing customized ETL scripts. Or add metadata to event data streams, to categorize events or facilitate action service processing.
-
Identify entity types with entity policies.
Provide a tag for instances of an entity type, or standardize metadata from different sources so that, for example, all Kubernetes clusters have the same tags and can be easily found.
-
Manage anomaly detection with anomaly policies.
Add or subtract metrics from the list of metrics for which the anomaly detection service trains models.
A datasource associates an incoming stream of data with one or more policies. Policies are not used unless they are included in a datasource.
When to customize
You do not need to customize any of the default policies that Virtana provides to monitor your environment. The defaults have been tested extensively in production and work as designed.
-
You may wish to customize an anomaly policy to add a metric to the anomaly detection service. You are welcome to do so at any time.
-
If you wish to integrate an application or add a new, custom datasource, contact Virtana Support to arrange assistance creating a custom ingest or entity policy.