OpenTelemetry
OpenTelemetry, also known as OTel, is an open source, observability framework that helps IT teams collect, process, and export telemetry data, including metrics, so that they can better understand and troubleshoot their IT applications and infrastructure. Because OpenTelemetry is both vendor-neutral and tool-neutral, you can use it with various observability backends like Virtana Service Observability. Service Observability can help ease the pain of monitoring different infrastructure pieces using various technologies, like OTeL, SNMP, WBEM, SMI-S, and other vendor specific technologies.
OpenTelemetry enables observability through collecting, processing and exporting signals, like metrics, that provide a look at the underlying activity of the operating system and applications running on a platform. Because metrics can capture a measurement, like memory usage, of a component or service at a point in time, you can analyze not just the measurement itself, but also the time at which it was captured and the associated metric metadata known as attributes in OpenTelemetry.
In Virtana Service Observability, you can integrate with OpenTelemetry to collect sum, gauge, and histogram metrics to gain insights of the behavior of your applications. When OpenTelemetry is integrated with Virtana Service Observability, developers can leverage existing metric analysis tools in Service Observability while benefiting from enhanced observability capabilities.
Service Observability leverages the following key OpenTelemetry components:
-
OTLP specification for defining the encoding of telemetry data and the protocol used to exchange data between the client and the server.
-
Collectors for receiving, processing and exporting telemetry data collected from instrumented applications. They collect data from multiple sources, process it, then export the processed data to back-end storage or analysis systems.
Getting Started
The OpenTelemetry sample tutorial guides you through setting up the OpenTelemetry Collector, a proxy that receives, processes, and exports telemetry data for you. Exporting OpenTelemetry metrics into Virtana Service Observability uses the standard OpenTelemetry Protocol (OTLP). Most systems that support exporting OpenTelemetry data also support the OTLP protocol.
To get started, check that you meet the following prerequisites and then configure your application for exporting metrics using the OpenTelemetry Protocol (OTLP).
Prerequisites
Before getting started with OpenTelemetry, verify that you have the the proper permissions and a Virtana Service Observability API key:
-
Make sure your account is assigned the Key Administrator or Manager role.
-
Locate or generate your Virtana Service Observability API key. Ask your Virtana Service Observability administrator for your Virtana Service Observability API key or generate a key.
Configure your application for exporting metrics
Configure your application to use the OpenTelemetry Protocol (OTLP) for exporting telemetry data.
Configure your system to export your telemetry data using the following settings:
-
Exporter type:
OTLP -
Endpoint: The sample tutorial in this guide uses
https://api.zenoss.io:443, but your endpoint might differ. For more information to help you determine the correct endpoint to use, see Virtana Service Observability API endpoints. -
Header:
zenoss-api-key=YOUR-ZENOSS-API-KEY
OpenTelemetry sample tutorial
This sample tutorial walks you through configuring an OpenTelemetry Collector using the OpenTelemetry Collector Contrib distribution of the collector on a Linux system. Then, you will add three metrics to a dashboard in Virtana Service Observability. Finally, you will edit the configuration file to augment the data.
Follow this sample tutorial to complete the following tasks:
-
Set up an OpenTelemetry collector on a Linux system to export sample system.cpu.load_average metrics to Virtana Service Observability.
-
Create a dashboard to see how you can visualize the metrics in Virtana Service Observability.
-
Augment the data to separate the data into different sources so you can filter the data in your dashboards and other features.
Setting up the OpenTelemetry Collector
The OpenTelemetry Collector (otelcol) is a vendor-neutral way to receive, process, and export telemetry data. It supports receiving telemetry data in multiple formats, processing it, and then sending it to one or more backends.
The following configuration instructions assume that you have installed the OpenTelemetry collector. If you haven’t yet installed the collector, see the installation documentation.
Additionally, these instructions assume that you have the OpenTelemetry Collector Contrib distribution of the collector installed on a Linux system. If not, first access the otelcol-contrib distribution and install it on a Linux system using the installation documentation.
Configure the OpenTelemetry Collector
This example configuration is one possible simple configuration for getting metric data into Virtana Service Observability. For these instructions, you need the OpenTelemetry Collector Contrib distribution (otelcol-contrib) of the collector installed on a Linux system. The OpenTelemetry Collector Contrib is a good distribution for getting started because it contains many built-in receivers, processors, and exporters.
By default, the otelcol-contrib service looks for its configuration in the following file:
/etc/otelcol-contrib/config.yaml
Perform the following steps:
-
Go to the OpenTelemetry Collector configuration file located in the
/etc/otelcol-contrib/directory. -
In the
config.yamlfile, do the following:-
Set the endpoint URL to the appropriate value.
-
Replace
YOUR-ZENOSS-API-KEYwith a valid API key.
-
-
This file accomplishes the following steps:
-
Configures the receiver to collect metric data.
-
Sets up the processor that adds attributes (metadata) to the data
-
Sets up an exporter that sends the data to Virtana Service Observability
-
Sets up a metrics pipeline to use the receiver, processor, and exporter together.
receivers:
  # Gather system load metrics from the host.
  # https://github.com/open-telemetry/opentelemetry-collector-contrib/blob/main/receiver/hostmetricsreceiver/README.md
  hostmetrics:
    scrapers:
      load:

processors:
  # Automatically add attributes such as host.name and os.type.
  # https://github.com/open-telemetry/opentelemetry-collector-contrib/blob/main/processor/resourcedetectionprocessor/README.md
  resourcedetection:
    detectors: [system]

exporters:
  otlp/zenoss:
    endpoint: "http://api.zenoss.io:443"
    headers:
      zenoss-api-key: "YOUR-ZENOSS-API-KEY"

service:
  pipelines:
    metrics:
      receivers: [hostmetrics]
      processors: [resourcedetection]
      exporters: [otlp/zenoss]
Note
The OpenTelemetry Collector Contrib distribution has many other receivers, processors, and exporters available.
-
-
Restart the
otelcol-contribservice after configuring it by running the following command:sudo systemctl restart otelcol-contrib
Adding metrics to a Virtana Service Observability dashboard
Continuing with the sample use case, after configuring the OpenTelemetry Collector to send data from the "load" scraper of the "hostmetrics" receiver, you now have three new metrics available in Virtana Service Observability:
-
system.cpu.load_average.1m
-
system.cpu.load_average.5m
-
system.cpu.load_average.15m
Create a dashboard
To view these new metrics, create a new dashboard using the following steps.
-
Log in to Virtana Service Observability as a user with the Manager role, and then open DASHBOARDS.
-
Open the Dashboards panel on the left and click NEW DASHBOARD.
-
(Optional) In the name field, replace My Dashboard with a more descriptive name for the dashboard, such as OTel Default.
-
Specify the scope to include the source that you previously added. Click ADD ENTITIES, then enter the name of the source,
otel-default, in the Other sources field. Click the matching otel-default from the list of other sources. -
Click the checkmark to confirm, then click SAVE.
Configure a Graph tile
Add a graph tile to the dashboard and configure it to show the new metrics.
-
Click ADD A TILE. In the AVAILABLE TILES palette, click Graph to add it to the dashboard. The GRAPH panel opens on the left side. By default, the TILE CONFIGURATION tab is selected.
-
In the Entity and metric field, enter
systemthen choose system.cpu.load_average.1m in the list that appears.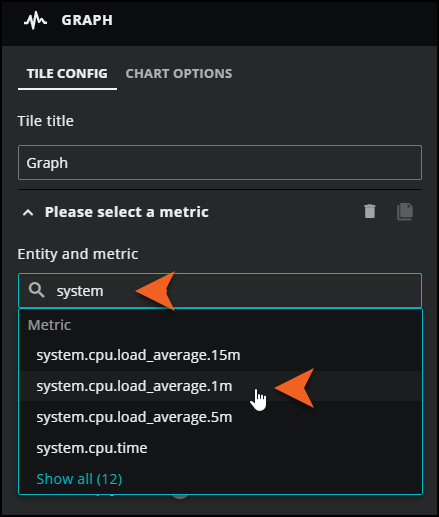
-
In the Aggregator dropdown list, select none. Click SAVE.
As a best practice, if you just set up the collector, you might want to focus on a very recent timeframe, such as the last hour. For more information about viewing metrics in the Graph tile for OpenTelemetry, see Graph tile configuration.
Note
If you click on a line in the graph tile, Virtana Service Observability directs you to Smart View for the metric's entity where you can see other metrics collected for the entity.
Augmenting the data
In the previous section, you added the otel-default source to your dashboard scope to show metrics from the collector. When you send more OpenTelemetry data into Virtana Service Observability, you may want to separate the data into different sources so you can easily filter the data in your dashboards and other features.
To accomplish this task, use the collector's resourceprocessor to set the resource's source attribute to any value you want.
The configuration file in the task shows the previous configuration, but this file uses resourceprocessor to add a "source=mysource" attribute to all of the data:
  # Add a "source=mysource" attribute to all resources.
  # https://github.com/open-telemetry/opentelemetry-collector-contrib/blob/main/processor/resourceprocessor/README.md
  resource/source:
    attributes:
      - action: insert
        key: source
        value: "mysource"
In the following task, you will also update service.pipeline.metrics.processors to add the new processor to your pipeline:
service:
  pipelines:
    metrics:
      receivers: [hostmetrics]
      processors: [resourcedetection, resource/source]
      exporters: [otlp/Service Observability]
Augment the data
Perform the following steps to augment the data:
-
Make the following changes in the configuration file:
receivers: # Gather system load metrics from the host. # https://github.com/open-telemetry/opentelemetry-collector-contrib/blob/main/receiver/hostmetricsreceiver/README.md hostmetrics: scrapers: load: processors: # Automatically add attributes such as host.name and os.type. # https://github.com/open-telemetry/opentelemetry-collector-contrib/blob/main/processor/resourcedetectionprocessor/README.md resourcedetection: detectors: [system] # Add a "source=mysource" attribute to all resources. # https://github.com/open-telemetry/opentelemetry-collector-contrib/blob/main/processor/resourceprocessor/README.md resource/source: attributes: - action: insert key: source value: "mysource" exporters: otlp/zenoss: endpoint: "http://api.zenoss.io:443" headers: zenoss-api-key: "YOUR-ZENOSS-API-KEY" service: pipelines: metrics: receivers: [hostmetrics] processors: [resourcedetection, resource/source] exporters: [otlp/zenoss] -
Restart the
otelcol-contribservice after configuring it by running the following command:
sudo systemctl restart otelcol-contrib
You can now add mysource to any dashboard scope where you want to see this data without sending in other data received from the otel-default source.
OpenTelemetry terms in Virtana Service Observability
In some cases, Service Observability and OpenTelemetry share similar concepts, but use different terms for them. Use the following mappings to understand how OpenTelemetry data is represented in Virtana.
- resource/entity
- In OpenTelemetry, resource is an entity in Virtana Service Observability. This is a one-to-one mapping with no caveats.
- attributes/dimension attributes
-
In OpenTelemetry, data is described by attributes. Each unique combination of attributes (name-value pair) represents a unique item. For example, two resources might be alike in all ways except that they have different values for the
hostattribute. Therefore, these are two distinct resources.In Virtana Service Observability, the equivalent of attributes is dimension attributes. This is different from metadata attributes that are extra attributes that do not make the item unique. Therefore, when Service Observability receives OpenTelemetry data, it treats all attributes as dimension attributes.
Additional resources
See the following resources to learn more about the key OpenTelemetry components used in this sample tutorial.