2021 updates
Here are the visible new features or enhancements released in 2021.
December 16
The action service is now available to everyone!
The action service provides tools for responding automatically to changes in your environment. You configure it to examine incoming events or metric data points and send notifications (one-way messages) when conditions match the criteria you specify. Here are the documentation resources:
There are no Collection Zone changes in this update.
December 9
This update includes the following changes:
-
Enhanced time range controls.
The enhanced controls include more quick-select options, time zone settings, custom time ranges for the quick-select menu, and more. The time range controls are available on all dashboard and Smart View pages.
-
A new interface for managing Zenoss API Clients.
The new interface presents API Clients in a table and includes a simpler method for generating API keys.
There are no Collection Zone changes in this update.
December 2
This update includes new names for entity types.
Entity type names now include consistent prefixes, to make it easier to find a type when creating a scope.
The new names are just the old names with a prefix, except VMWareEntity, which is now VSphere.vSphereEntity.
The scopes of existing dashboards are updated with the new names.
There are no Collection Zone changes in this update.
November 30
This update includes a new dashboards feature, the copy tile option. Now you can copy tiles from any public dashboard to a new dashboard or any dashboard you own.
There are no Collection Zone changes in this update.
November 18
This update includes the following changes:
-
A recent query optimization removed a Collection Zone event field (
lastSeen) from the list of fields sent to Data Access tables, and this update restores the field to the list. -
The help menu in the Zenoss Cloud header now includes a full list of links for the new documentation site.
November 16
This update includes a new home for Zenoss Cloud documentation, docs.zenoss.io! The new site is a major upgrade and includes lots of new features and helpful content. Check it out!
There are no Collection Zone changes in this update.
November 2
This update includes the following changes:
- A new share button on Smart View pages. Click the share button to get a URI you can send to others.
- Users with the Read Only User role no longer see dashboard templates.
There are no Collection Zone changes in this update.
October 19
This update includes the following changes:
- The home page header now includes a tab for Collection Zones (EXPLORE CZ). For organizations with multiple Collection Zones, the tab is a menu.
- The service status indicators in Service Health tiles now match the service health status reported in Service Impact.
There are no Collection Zone changes in this update.
September 23
This update includes the new options for configuring system preferences, including:
- A default theme (light mode or dark mode).
- A default home page, which can be a dashboard, Smart View page, or any other Zenoss Cloud page.
- Options for replacing the Zenoss logo and favicon with your own.
The preferences are available in a new location, the ADMIN > System Preferences page.
September 21
This update includes the following additions and enhancements:
-
A new dashboard tile, the Entity Count tile.
The tile displays the total number of Collection Zones entities of a given type.
-
A new service can be managed with the Zenoss API, the event management service.
You can update existing events with new status information or with text annotations.
There are no Collection Zone changes in this update.
September 16
This update includes a new refresh option on Smart View pages and a new look for the time range controls on pages that include them.
There are no Collection Zone changes in this update.
August 17
This update includes the following additions and enhancements:
- The browser interface is updated with a new look and feel for controls in the headers of dashboard and Smart View pages.
- The Zenoss API now includes the user management service, which provides resources for creating and managing Zenoss Cloud users and groups.
- The show events control on Smart View pages is changed from a drop-down list to toggles, and the default now is to show the events tile on anchor cards.
There are no Collection Zone changes in this update.
July 20
Smart View pages now include a show events control in the header area, which allows you to display events timelines in the anchor card area, in the related entities area, in both areas, or in neither. The default is neither.
There are no Collection Zone changes in this update.
July 9
Zenoss Cloud collector appliances are updated and the latest versions are available on delivery.zenoss.io. The following image shows their locations:
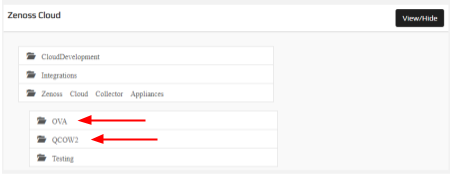
In addition, collector installation procedures are updated to remind users to use the latest package file from delivery.zenoss.io when installing a collector.
July 1
Zenoss Cloud now includes events consoles, which display all events, from both Collection Zone and streaming data sources. In support of this new interface, the Zenoss API includes a new resource for creating events as well.
In addition, this update includes the following enhancements:
-
All links in dashboard tiles now support "open in new tab/window" options.'
-
You can configure a Graph tile to display an empty series, if desired. A series is empty when no data points are found for a metric during the current time range.
-
The anchor card and related entities areas of a Smart View page are now fully resizable.
There are no Collection Zone changes in this update.
June 24
This update includes the Anomalies tile, which shows entities in the dashboard's scope that have the highest number of anomalies during the current time range.
There are no Collection Zone changes in this update.
June 10
This update includes a change to Smart View: The anchor card now displays all the metrics associated with an entity, not just the first 50 metrics.
There are no Collection Zone changes in this update.
June 8
This update adds dependency views to the related entities area in Smart View. A dependency view displays an interactive, hierarchical graph of the entities on which an anchor entity depends.
There are no Collection Zone changes in this update.
May 11
This update features a new dashboard tile, the Stoplight tile, which provides a summary of the status of one metric or of one entity and one metric.
There are no Collection Zone changes in this update.
March 30
Two features are generally available with this update:
- The Map tile is now available for use in Zenoss Cloud dashboards. Monitor locations at a glance!
- The restriction filters feature now includes support for Smart View pages and is available to all customers.
There are no Collection Zone changes in this update.
March 23
This update includes the following enhancements:
- The Service Health tile now supports the option of filtering the dashboard's scope, and the option of displaying the availability or performance state, or both states.
- The user administration interface has been consolidated and improved. The ADMIN > Users and ADMIN > Groups pages are replaced by the ADMIN > Users & Groups page.
There are no Collection Zone changes in this update.
March 2
This update includes the following dashboard enhancements:
- The Graph tile now includes new metric ordering features. To enable the features, Zenoss Cloud now retrieves data points for all relevant metrics in a dashboard's time range, which may slow the display of tiles when there are many metrics in the time range.
- The Event Count tile now includes a variety of filtering options, to enable precise, at-a-glance status visualizations.
There are no Collection Zone changes in this update.
January 29
This update includes Collection Zone enhancements and fixes.
Of particular note:
- The Dynamic View feature will be deprecated in the next Collection Zone release.
- The option to retain performance data when re-identifying a device is deprecated.
There are no Zenoss Cloud changes in this update.
Enhancements
This update includes the following performance, reliability, and usability enhancements:
- The job processing service is redesigned, greatly improving its performance and reliability. The only visible change is the addition of a new job status, Retry, which identifies jobs that have been placed back on the queue (with a delay) for another run.
- The event processing system is improved and now manages higher load.
- Process monitoring now includes per-process memory threshold options. For more information, see Process class options.
- Users must confirm their choice when setting a maintenance window on a root class and when deleting a root device class.
- Embedded databases and other enabling technologies are updated.
- Users with the ZenOperator role can now perform basic tasks on devices and events within their assigned scope.
- The notification feature now supports SNMP v3.
Fixes
The following fixes are included in this update:
- Monitoring a device no longer stops when an event of class /Status/SNMP is received.
- SNMP v3 traps are no longer displayed as v2 traps.
- SNMP traps with varbind names are now handled per RFC conventions.
- SNMP Index information is present in the details of SNMP devices.
- The ssh command now resets connections after timeouts.
- Users with the ZenOperator role can now acknowledge and close events.
- The functionality of the REPORTS > Organizer Graphs page is now updated to handle large numbers of graphs.
- Restarting a Collection Zone no longer leads to a spike in false positive threshold events.
- Users with the ZenManager role can now add user commands.
- Customizations of the Event Console are retained now.
- The Open Events Chart portlet now displays correct data for any arbitrary number of days that you specify.
- Modeling devices manually now completes without taxing the model processing service.
- In multigraph reports, graph groups can now be edited.
- Zope services no longer block when the WBEM ZenPack is installed.
January 7
The Service Health tile now includes two additional configuration options:
- Choose one or more specific services to include in a tile.
- Choose to display Availability or Performance indicators, or both.
There are no Collection Zone changes in this update.