2024 updates
Welcome to the 2024 update notes for Zenoss Cloud. The visible and not-so-visible parts of Zenoss Cloud are updated regularly. This page highlights the new features and enhancements.
December
This month's updates include the following enhancements:
Smart View
In Smart View, hold the point over a metric or entity name to view metric details or entity details. Previously, you could only view names, definitions, and tags.
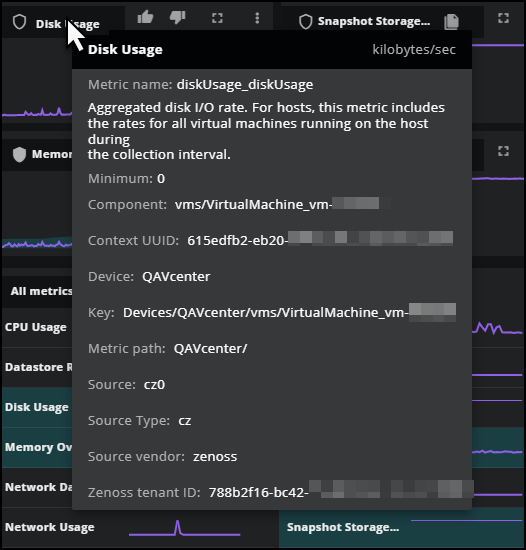
This is useful when you have new sources sending data into Zenoss, such as OpenTelemetry sources, and you want to better understand the types of metadata that you are receiving.
Hold the pointer over the name of each metric to view details about the metric's properties and metadata. You can also hold the pointer over the name of the anchor entity and related entities to view details about the selected entity's properties and metadata.
To learn more, see Smart View.
Streaming > OpenTelemetry
Zenoss now offers support for OpenTelemetry, also known as OTel, an open source, observability framework that helps IT teams collect, process, and export telemetry data.
In Zenoss, you can integrate with OpenTelemetry to collect sum, gauge, and histogram metrics to gain insights of the behavior of your applications. When OpenTelemetry is integrated with Zenoss, developers can leverage existing metric analysis tools in Zenoss while benefiting from enhanced observability capabilities.
To get started, follow the sample tutorial to guide you through setting up the OpenTelemetry Collector, adding sample metrics to a dashboard, and editing the configuration file to add more data.
To learn more about OpenTelemetry and Zenoss, see OpenTelemetry.
Administration > Maintenance Windows
The Maintenance Windows feature, previously called Inventory Management, is now updated with new tabs and user workflows.
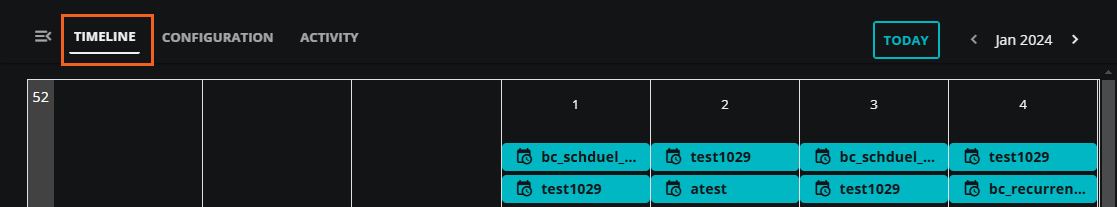
When you open Maintenance Windows (ADMIN > Maintenance Windows), you are on the TIMELINE tab. Here, you can view your scheduled, in-progress, and completed maintenance windows.
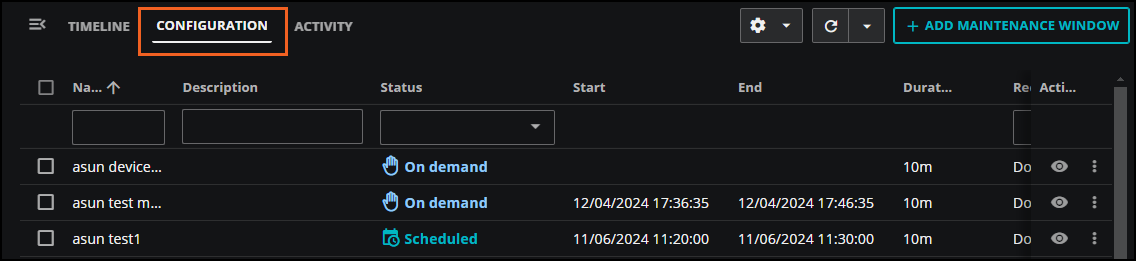
Click the CONFIGURATION tab (previously the MAINTENANCE tab) to view a table of your scheduled and on-demand maintenance windows. You can filter the table to show only scheduled or on demand windows or both types.
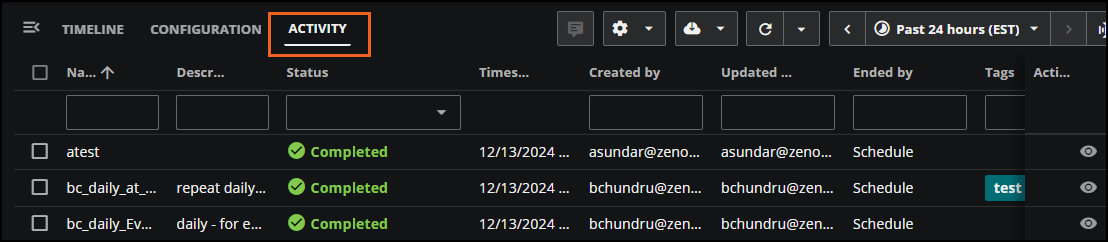
The HISTORY tab is now the ACTIVITY tab. The ACTIVITY tab displays the log of in-progress and completed maintenance windows in a table.
To learn more, see Maintenance Windows.
November
This month's updates include the following enhancements:
Administration > Dictionary
You can now use the METRIC FIELDS tab in Dictionary service to provide more readable and compact alternatives to computer-generated metric field names. Metric field entries are used in Dashboards, particularly in graph tiles, and trigger criteria.
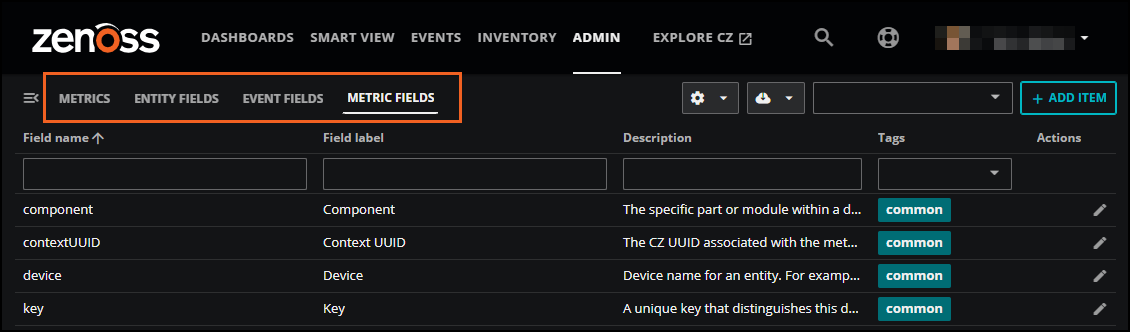
Metric field names are useful when you are sending telemetry data, such as metrics and their metadata, into Zenoss from sources other than collection zones, such as OpenTelemetry collectors or APIs. You can create dictionary entries for these metadata attributes so your organization can more easily identify them in graph tiles on dashboards and trigger criteria in Actions.
To learn more, see Dictionary service.
Dashboards > Graph Tile
Now, you can use the improved Label format field in the Graph tile of Dashboards to help your users identify and analyze telemetry data.
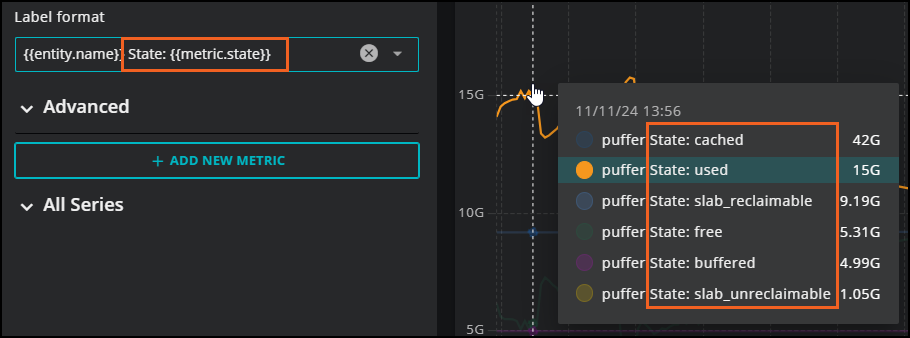
In the graph tile, you can create labels to include in hover text and in the legend using the mustache template system. If needed, you can enter your own label format in the field by using any combination of metric, entity, and parent entity fields. These can either be entered into the box or selected from the provided list. As you enter text, the list is filtered to only fields that match what you entered.
Labels on graph tiles are useful when sending telemetry data, such as metrics and their metadata, into Zenoss from sources other than collection zones, such as OpenTelemetry collectors or APIs. You can use graph tile labels in combination with the metric field names in the Dictionary entries to more easily identify metadata attributes in graph tiles on dashboards and trigger criteria in Actions.
To learn more, see Graph Tile.
New help center in Zenoss Cloud
The new Zenoss Help Center is the in-product hub to find documentation about Zenoss Cloud features, including new feature announcements and links to the product documentation site. This easily accessible center is useful when you want to go back to new feature announcements you might have missed or search for a specific help topic.
To begin, click the Zenoss Help Center button (life buoy) in the header.

-
For new feature announcments, click What's New? to open a list of feature announcements available to you.
-
For external documentation, click Help Resources to access links to documentation and available training offerings.
October
This month's updates include the following enhancements:
Default views
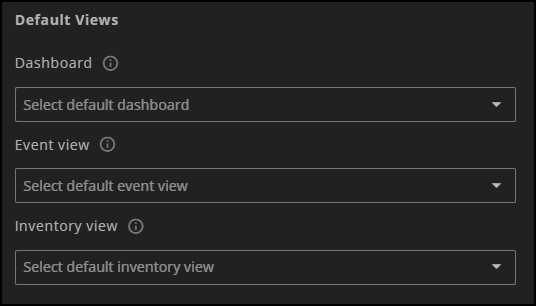
You can now set more default views in Zenoss Cloud, including a default dashboard, events view, and inventory view. Administrators can also set default dashboards, events views, and inventory views for their customers and user groups.
Administration > System Preferences
As a Zenoss administrator, you can access the new Default Views settings in System Preferences. Choose any shared dashboard, event view, or inventory view for your users. When navigating to Dashboards, Events, and Inventory, users see the views selected here. Users can override these settings with any personal or shared dashboard or view.

To learn more, see System Preferences.
Administration > Users & Groups
When creating or editing a group as a Zenoss administrator, you can choose any shared dashboard, event view, or inventory view for the group.
When users in the group navigate to Dashboards, Events, and Inventory, the selected view will open. Views entered here override any views selected in System Preferences for users in the group.
To learn more, see Users and Groups.
User Preferences
When setting your own preferences as a user, you can choose any personal or shared dashboard, event view, or inventory view. When you navigate to Dashboards, Events, and Inventory, the selected view will open. This preference overrides the system preference set by your system administrator.
To learn more, see User preferences.
You can also set a default view when you are in Dashboards, Events, and Inventory. For example, if you are working with a dashboard that you decide to set as your default, then:
-
Open the Dashboards panel. Click the Dashboards menu button in the upper-left corner of Dashboards.
-
Go to the specific dashboard and click the Actions (⋮) menu.
-
Select the Default box to set your user preference.

To learn more, see Dashboards, Events console, and Inventory.
Inventory
In Inventory, you can view the related events for a selected entity. In the table, click the eye icon in the Actions column for the entity. In the ENTITY DETAILS dialog box that opens, click the RELATED EVENTS tab to view the related events.

To learn more, see Inventory.
Inventory Management > Maintenance Windows
There are several enhancements for maintenance windows:
Recurring maintenance windows
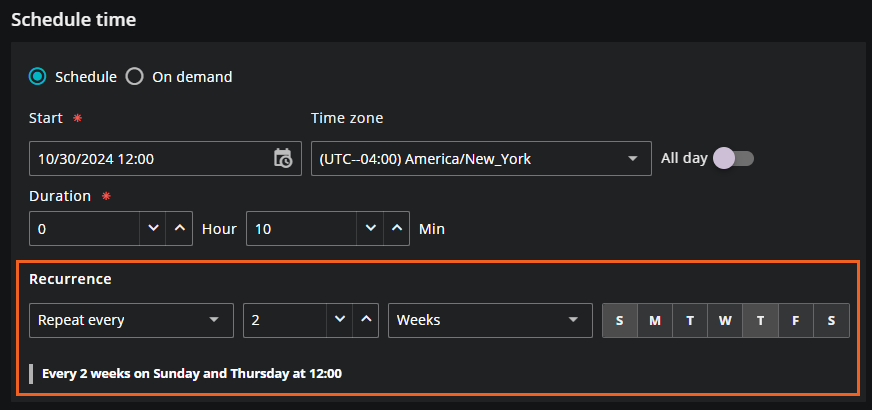
You can now fine-tune recurrence options when scheduling maintenance windows. You can schedule maintenance windows to occur on specific days of the week or month, such as the last day of every month.
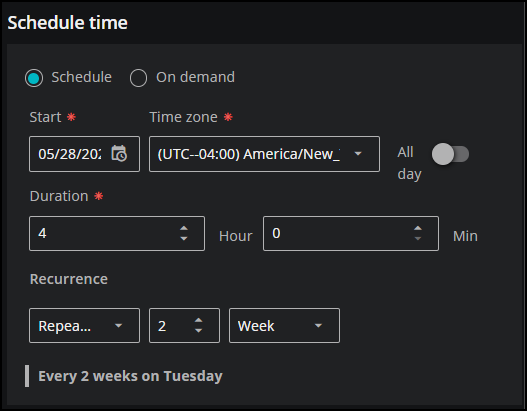
Additionally, you can specify if you want a maintenance window to repeat on specific days of the week. For example, you might schedule a maintenance window for every two weeks on Wednesdays and Saturdays. In this case, use the day picker to indicate the days of the week for the recurrence.
To learn more, see Scheduling maintenance windows.
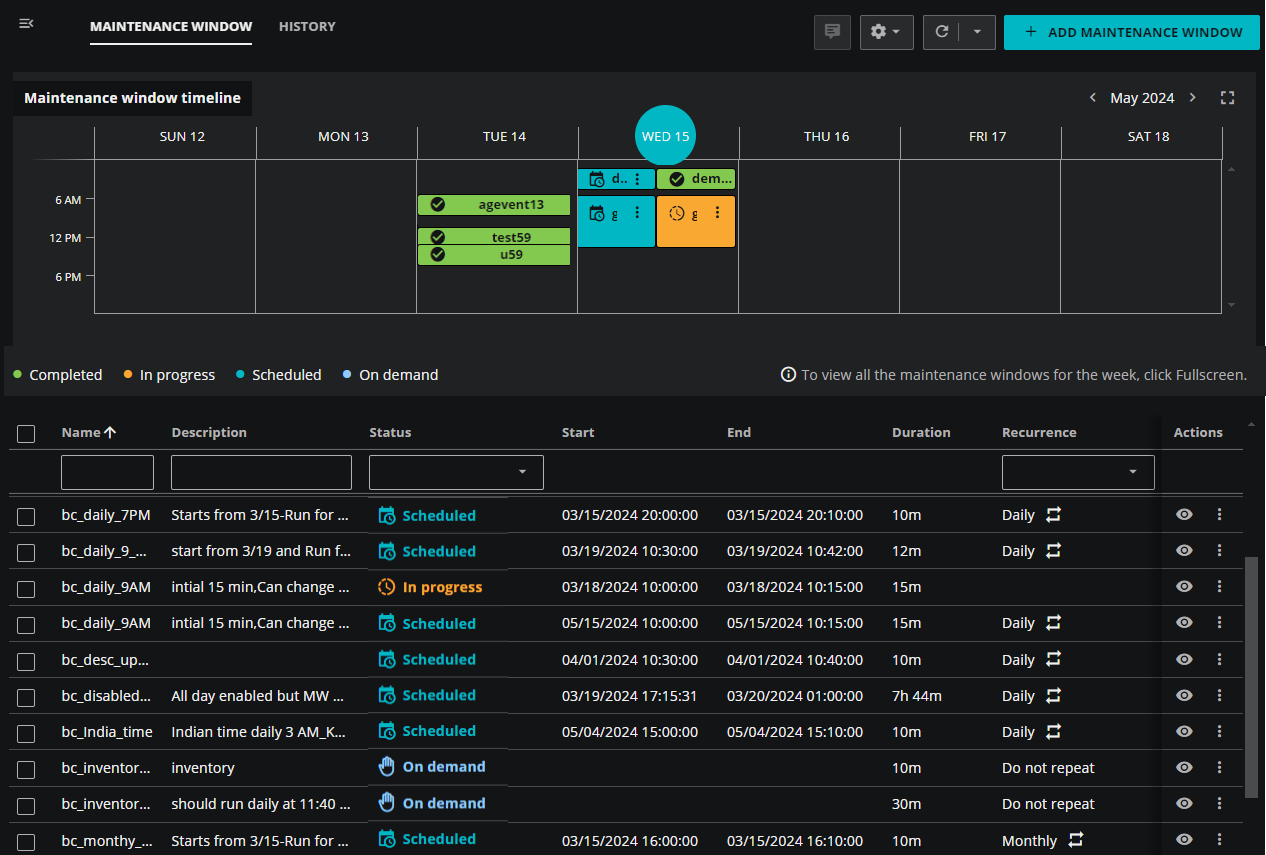
Maintenance window timeline
After you create a scheduled maintenance window, the upcoming scheduled recurrences appear on the timeline and full-screen calendar views. For example, if you create a maintenance window for Wednesday and Saturday of every week, both future instances appear on the maintenance window timeline for the week.
You can also filter the timeline to show only completed, in-progress, or scheduled windows or a combination of two types. Click the corresponding button to select or clear that type of maintenance windows in the timeline:

To view more details about an in-progress or scheduled maintenance window in the timeline, click the window to filter the table below to show just that maintenance window.
To view more details about a completed maintenance window in the timeline, click the window to go the History tab.
To learn more, see Maintenance window timeline.
Events console
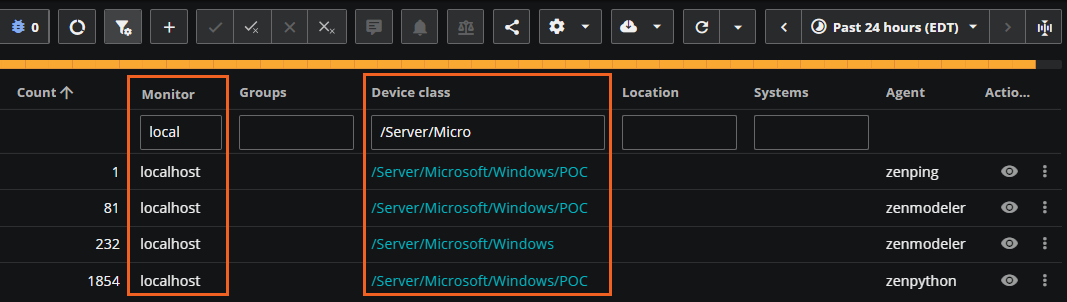
The Events console features a few minor improvements for building event views based on specific types of events. These improvements are useful if you have a lot of entities in your CZ that you want to manage in the Cloud.
To support this workflow, you can now filter and sort the following CZ event fields:
- Device class
- Systems
- Groups
- Location
- Agent
- Monitor
In addition, you can now sort by the Count column.
Dashboards > Event List + Count tile
The Event List + Count tile in Dashboards is improved. Previously, if a “group count by” indicator had a lot of groups, the appearance of the donut chart was impacted. Now, the donut chart handles a lot of groups by providing a top ten list.
Hover your mouse over a section of the donut chart to view the top ten groups by count of events. The remaining groups are collapsed into a single ...other group that is color-coded as gray. This is helpful if you select an indicator that has many groups, such as Entity or Event class.
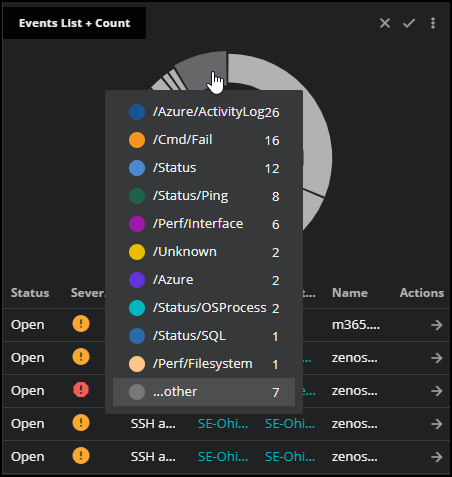
To learn more about how the Event List + Count tile displays many groups, see Event List + Count tile.
Site Availability Monitor (SAM) > Status parameters
The Site Availability Monitor (SAM) connector is now configured with default ranges of response codes to indicate when a site has a status of Up and when a site has a status of Down.
-
When the response code is in the range of 100-299, the site is assigned a status of Up.
-
When the response code is in the range of 300-599, the site is assigned a status of Down.
For a specific site or subpage, you can define response codes that you want to exclude or include in these ranges using the exclusions and additional parameters.
To learn more about status parameters, see Site Availability Monitor connector.
Zenoss Cloud header > Maintenance window icon
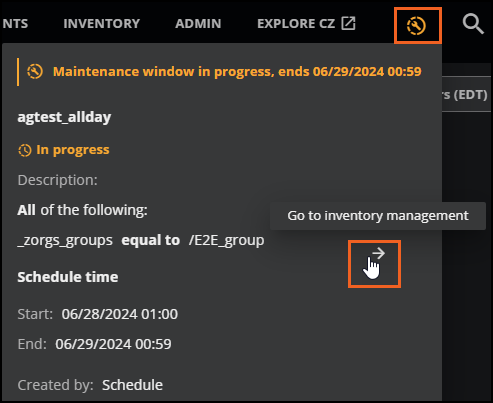
You can now view details for in-progress maintenance windows in Events and Inventory. When a maintenance window is started, the in-progress icon appears in the Zenoss Cloud header.
Hover your mouse over the icon to display the details about the maintenance window. To further inspect the maintenance window, click the arrow icon to view the window details in Inventory Management.
Note
This arrow icon is only visible if you have applicable permissions. Your account must be assigned the Manager role to open Inventory Management.
To learn more, see Viewing details for in-progress maintenance windows.
September
This month's updates include the following enhancement:
Site Availability Monitor (SAM)
The Site Availability Monitor (SAM) connector now supports API token authentication, metadata tagging, and data payloads. You can set these parameters in the SAM configuration file.
-
SAM now supports authentication of sites that you can monitor. Configure credentials to specify a login method and authentication values. Authentication options include API token, bearer token, and username/password.
-
Configure data payloads for subpages using the
POSTmethod.
To learn more about these configuration options, see Site Availability Monitor connector.
August
This month's updates include the following enhancement:
Site Availability Monitor (SAM)
The Site Availability Monitor (SAM) connector now supports redirections. You can set redirection and content parameters for a site or for specific subpages. These parameters are useful if you want to fine-tune site availability monitoring when your sites are redirected. For example, your site might automatically redirect to a temporary "site down" page. In this case, you can configure these parameters to indicate that the site is down in your SAM dashboard tile even though a site page was reached.
To learn more, see Site Availability Monitor connector.
July
This month's updates include the following enhancements:
Dashboards
For a more consistent and intutitive experience, we removed the raw events toggle in the Map and Event List + Count tiles. In addition, the Top Event Producers tile now displays the same event count as the other dashboard tiles.
Zenoss Cloud header > Maintenance window icon
If you are in Dashboards and SmartView, you can view details for maintenance windows that are currently in progress. When a maintenance window is started, the in-progress icon appears in the Zenoss Cloud header.

Hover your mouse over the icon to show the details about the maintenance window. To further inspect the maintenance window, click the arrow to view the window details in Inventory Management.
Note
This arrow icon is only visible if you have applicable permissions. Your account must be assigned the Manager role to open Inventory Management.
To learn more, see Viewing details for in-progress maintenance windows.
May
This month's updates include the following enhancements:
Administration > Inventory Management
You can now schedule and manage maintenance windows for your entities in Zenoss Cloud. The new Inventory Management feature provides the tools you need to manage your organization's maintenance windows. You can add recurring and on-demand maintenance windows, define the notifications your teams receive for them, and manage the windows in the timeline and table views.
For example, you might want to notify your team when a maintenance window starts and then again when it ends. You can use the Actions page when scheduling your maintenance window to set up these notifications.
When you're looking ahead on your calendar, you might want to adjust your scheduled maintenance windows. Inventory Management provides tools to skip a run, shorten or extend the duration of a run, or quickly end an in-progress maintenance window. If you ever need to look back at completed runs, click the History tab to see the last month of completed maintenance windows.
In addition, you can schedule a maintenance window for entities in a query in Inventory. And if you forget to add a notification when creating a maintenance window, you can add triggers later in Actions or in Inventory Management.
Learn more
-
To learn more about maintenance windows and managing them for your organization, see Inventory management.
-
To get started scheduling maintenance windows, see Scheduling maintenance windows.
-
To add a maintenance window for a query in Inventory, see Maintenance windows in Inventory.
-
To learn more about setting up maintenance window notifications, see Setting up maintenance window rules and triggers.
-
To add a maintenance trigger for a maintenance window, see Add a maintenance trigger.
Inventory
You can add or edit the priority level for an entity in Inventory. For example, you can update a priority of "Normal" to "High" directly in Inventory using the Update priority option.
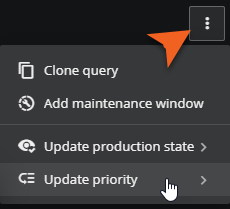
Priority provides a relative measure of importance, such as "Low" or "High", to help you narrow down a large set of entities. For example, you might want to focus your work on just those entities that you’ve marked as "highest" in importance. The Priority field helps with this task by providing you with a set of relative measures.
To learn more, see Priority.
Actions > History
-
In Actions > History, you can view the history of a selected action in its details panel. This extended history is useful when you are troubleshooting and auditing issues.
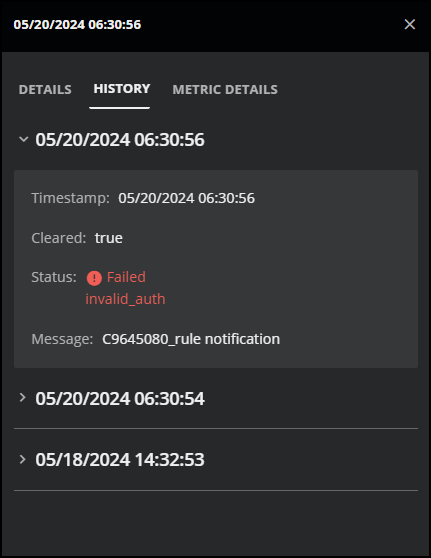
For example, you might be investigating a webhook destination issue with a third-party system. You want to see exactly when Zenoss initially sent a notification and what time Zenoss cleared that notification. The HISTORY tab in the details panel can help you do that.
To get started, open ADMIN > Actions page, and then click the HISTORY tab. To drill down into the history of a specific action, select History details (eye icon) in the row of the action. In the panel that opens, click HISTORY. The history of the action is listed in reverse-chronological order.
To learn more, see Manage actions.
-
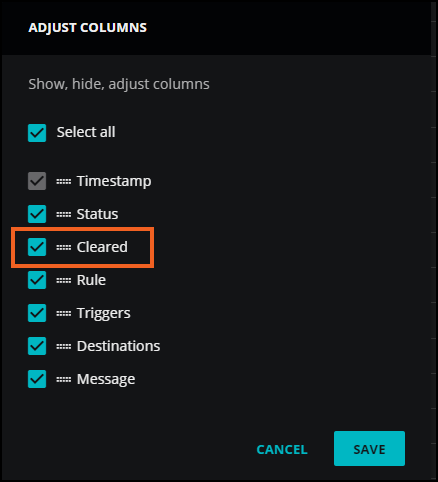
In the Actions > History table, you can include the Cleared column to help you troubleshoot and audit issues. If a notification has been cleared, a check mark appears in the row for that notification.
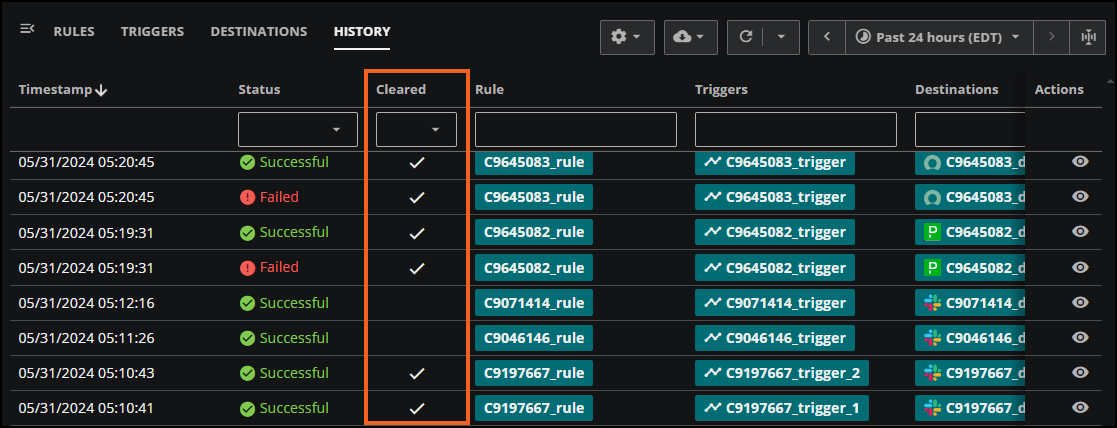
To add the Cleared column, click Settings and select Adjust Columns.
To learn more, see Manage actions.
Get Started > Multifactor Authentication at login
Starting May 14, 2024, Zenoss is enabling Multi-Factor Authentication (MFA), also known as Two-Factor Authentication or 2FA, for all users to help guard against cybersecurity threats. In addition to the standard credentials of a username and password, MFA requires an additional security code generated dynamically on another device.
If your organization isn't using its own identity management solution, then Zenoss provides multifactor authentication for your Zenoss account. When logging in, you will be prompted to set up Multi-Factor Authentication to continue. When you configure MFA for your user account, a second authentication method is triggered after entering login credentials. A verification code generated by an authentication app is required to complete the login process.
To learn more about setting up MFA, including recovery codes and commonly asked questions, see Log in to Zenoss Cloud.
Administration > Event Management
The new Event Management feature provides tools for you to manage your system’s event ingest.
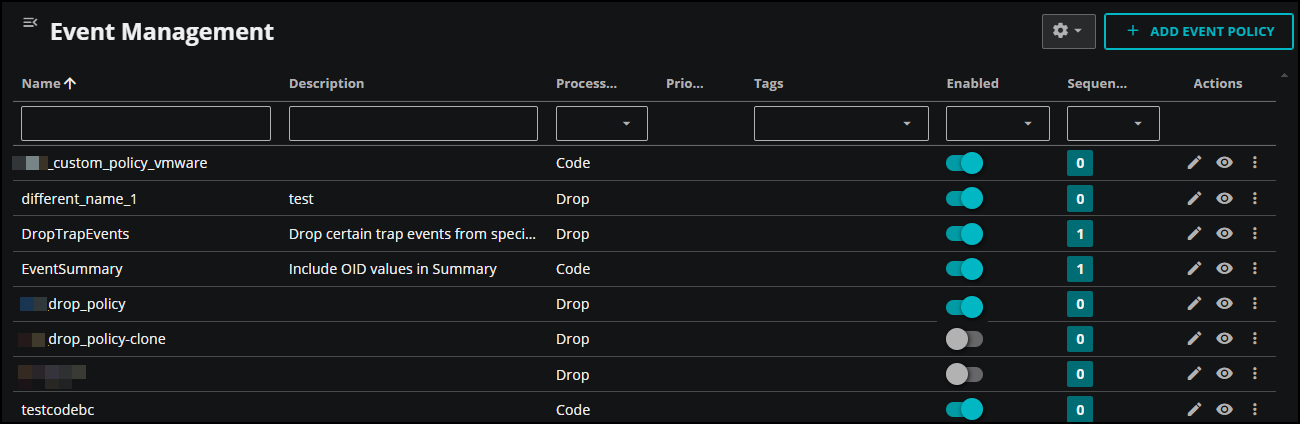
In Event Management you can create specific rules called event policies that provide more granular control of your incoming events, allowing you to handle more complex data formats and help you improve the accuracy and consistency of your event data.
You can use event policies to perform two common use cases:
-
Drop events that you don’t need
-
Transform the formats of a specific set of events
Dropping irrelevant events can help you reduce noise and decrease your storage, which can result in lower costs and greater efficiency. Transforming incoming events into a better format can help you quickly locate and analyze events so you can take action.
To learn more, see Event Management.
Actions > Triggers
In Actions > Triggers, you can create a stale data trigger to notify you when Zenoss hasn't received a metric or event after a specified duration of time. This feature is useful when you have important metrics or events that you expect to regularly receive, so failing to receive them indicates a possible problem the requires your attention.
To start using stale data triggers in your workflow, open ADMIN > Actions page, and then click the TRIGGERS tab. Select the Stale Data type when adding a trigger.
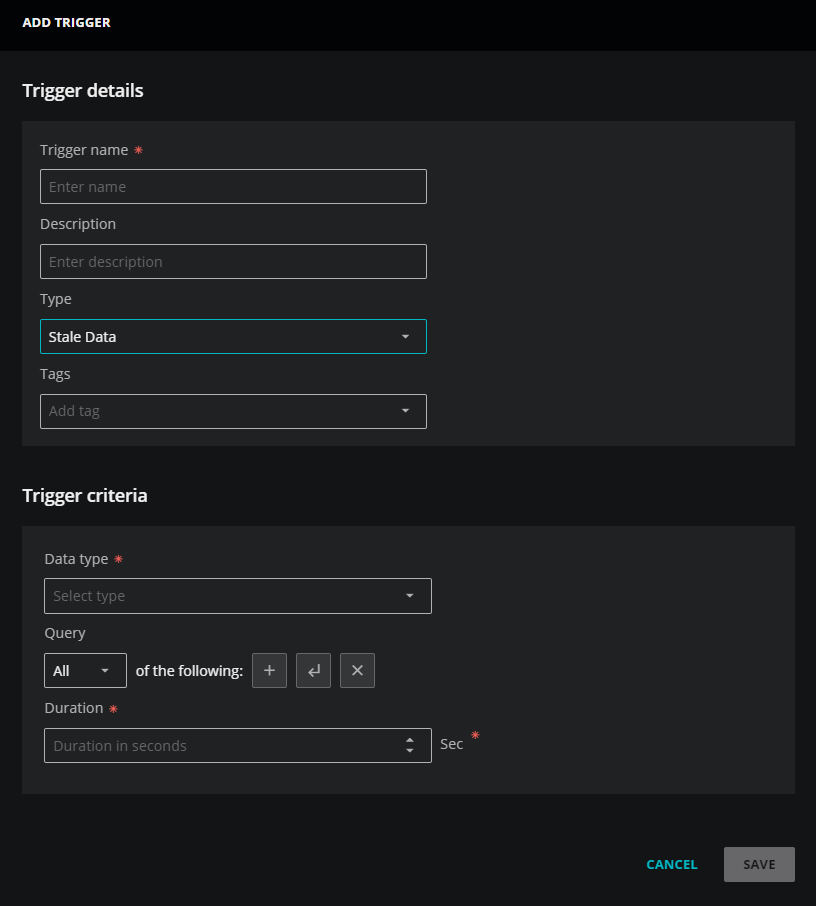
To learn more, see Adding stale data triggers.
April
This month's updates include the following enhancements:
Inventory
You can add or edit the production state for one or more entities in Inventory. For example, you can update a production state of Maintenance to Production using the Update production state option. Keep in mind that when you update a production states for an entity in Inventory, it doesn’t impact the assigned production state of the entity in Collection Zones (CZ).
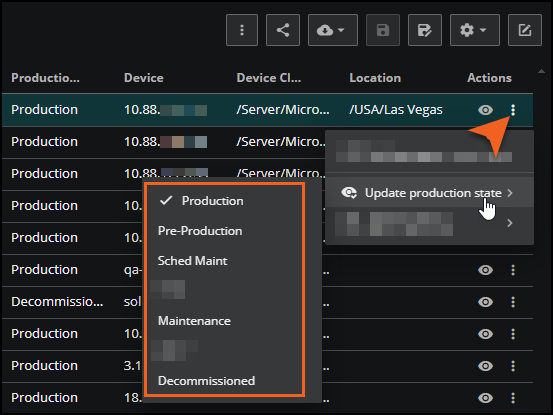
To learn more, see About production states and Update production states.
Actions
In Actions > Triggers, you can use the refined query builder when creating triggers.
In addition to simplifying the user interface, the query builder provides field suggestions from the Dictionary service and live data, and the suggestions are grouped by type. The suggestions for the Value field are also improved, suggesting values that apply to the field type.
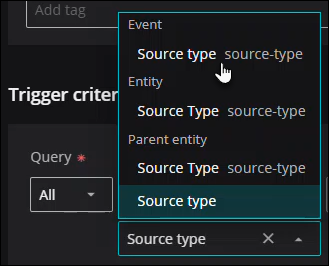
You can use the refined query builder to build triggers in Actions. To learn more, see Trigger queries.
Dashboards
The Dashboards view now includes the following enhancement:
Dashboard scope filter: You can now temporarily reduce the scope of your dashboard to just a subset of your entities. Click the Expand scope filter bar to open a query bar, then enter the criteria of the entities you want to view. The scope is temporary and won't be saved to the dashboard, but it can help you in your investigation.
This feature is useful if you are monitoring a large number of entities in a dashboard, but you just want to see information for a subset of the entities in the scope. For example, you might have a dashboard monitoring 10,000 devices, and you receive an error on device "X". You could then refine the dashboard scope by opening the scope filter and building a query of "name contains X". The dashboard displays only information that matches the query criteria.
For more information, see Filter the dashboard scope.
SSL Cipher Support
To ensure the highest security standards and safeguard your data, Zenoss is disabling support for several SSL Ciphers on Zenoss endpoints. These changes will be rolled out to Production environments on April 9, 2024 and will impact the
The following ciphers will be removed:
- TLS_ECDHE_ECDSA_WITH_AES_128_CBC_SHA
- TLS_ECDHE_RSA_WITH_AES_128_CBC_SHA
- TLS_ECDHE_ECDSA_WITH_AES_256_CBC_SHA
- TLS_ECDHE_RSA_WITH_AES_256_CBC_SHA
No action is required on your part. The TLS negotiations that occur to build secure sessions will use the other ciphers automatically. All modern browsers will continue to operate. For more information about SSL and TLS protocols, see the Google Cloud Load Balancing documentation.
March
This month's updates include the following enhancements:
Events
The Events console now includes the following enhancement:
-
Events load faster: Events now load more quickly in the Events console. When you initially open the Events console, you can quickly scan your most critical events on a single page. This new default mode is useful when you have a substantial number of events, but need to focus on the most important ones first.
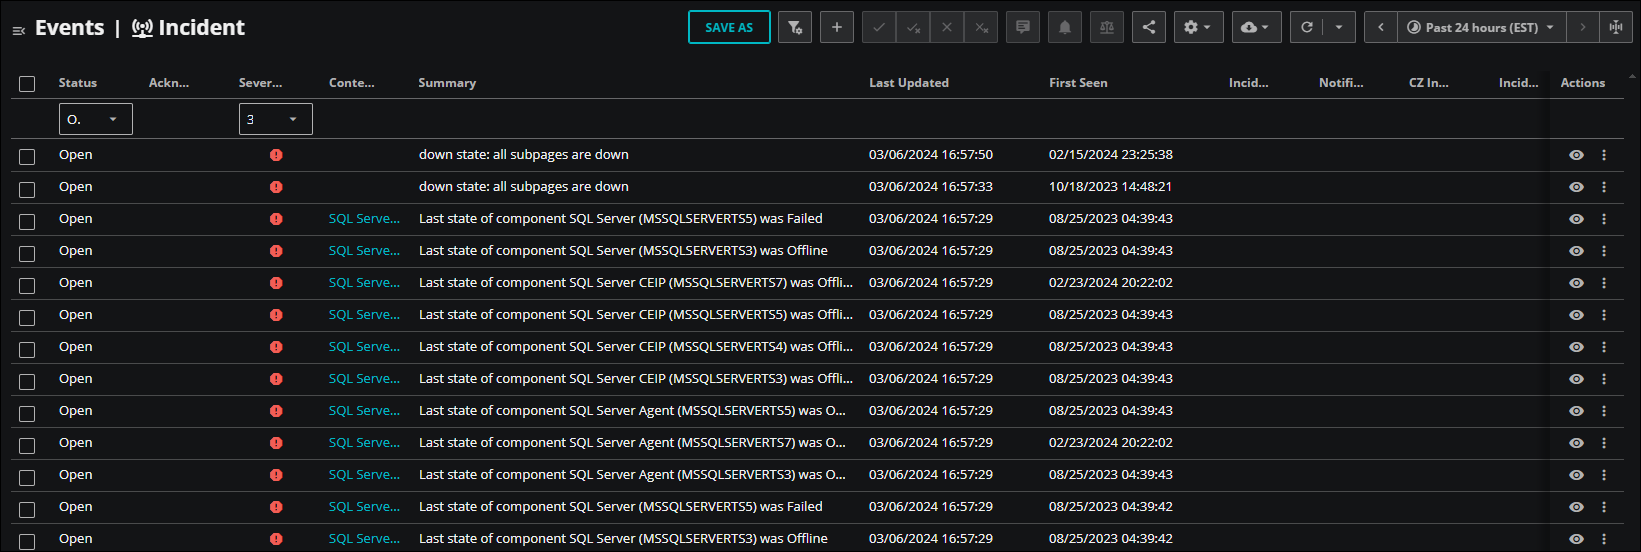
To access the full range of console features, including severity indicators, charts, and filtering, switch to advanced mode. Previously, advanced mode was the default view. Click the new Advanced mode button to switch between both modes for your selected events view.
By default, all your previously saved event views as well as the default templates open in advanced mode.
To learn more, see Events console.
Dashboards, Smart View, and Events
These pages now include the following enhancement:
-
Revised time range preset options: When you open the time range panel, you can select clear and simple preset options, including 10m (10 minutes), 1h (1 hour), and 3h (3 hours). Previously, these options were -5m, -1h, and -3h.
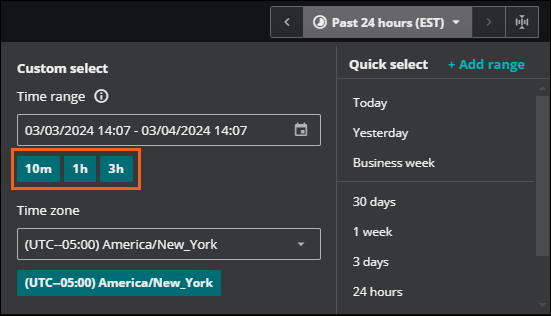
You can access the time range panel in Dashboards, Smart View, and Events. For more information, see Time range settings.
Inventory
Inventory now includes the following enhancement:
- Increased export limit: You can now export up to 100,000 rows of your Inventory table. For more information, see Exporting in Inventory.
February
This month's updates include the following enhancements:
Actions
The Actions service now includes the following enhancement:
-
Duration threshold: You can now refine your metric triggers by including duration with your minimum and maximum threshold values. The min/max over duration option is useful when you only want the trigger to alert you when a condition is met for more than a specified amount of time.
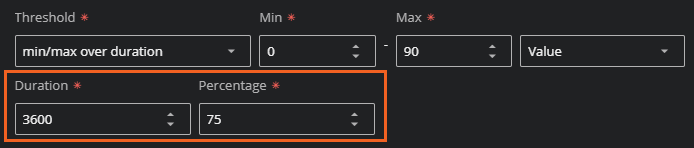
For example, you might have a CPU utilization metric that regularly spikes over 90% utilization, but you only want to be alerted if the utilization exceeds 90% for longer than 45 minutes. In this example, you can set the max value to 90 and then set the duration threshold time to one hour and the percentage of the duration to 75%.
Setting this option can reduce the noise of triggers that you typically ignore while focusing on the ones that are vital to your organization. For more information, see Add a metric trigger.
Dictionary service
Dictionary service now includes the following enhancement:
-
Enumeration field type: When you add a new dictionary entry for an entity field or event field, or if you edit an existing entry, you can now specify enumeration as the field type.
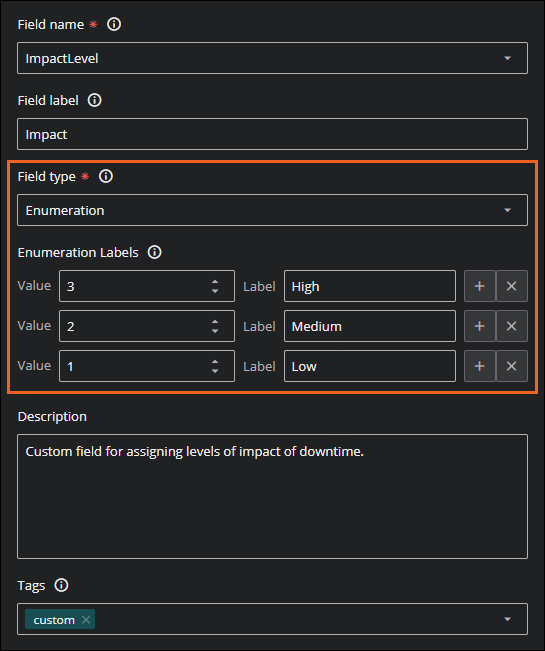
Enumeration field types use number values that are mapped to labels. For example, for Severity, you might have 1 = Debug, 2 = Info, and so on. This field type is useful if you want to create your own custom field with mapped values. For more information about setting up enumeration fields, see Adding and editing dictionary entries.
January
This month's updates include the following enhancements:
Events
The Events console now includes the following enhancements:
-
Create Event: You can now create an event in the Events console. While most events are programmatically created, manually creating events is useful if you want to test event mappings, event transformations, and triggers and notifications. For more information, see Create events in the Events console.
-
Event chart view: In the Events console, the column chart leverages new criteria for more precise analysis. Each column in the chart represents a slice of the selected time range. The events appear in the columns as defined by their First Seen and Last Seen criteria. Therefore, each event might appear in more than one column in the chart.
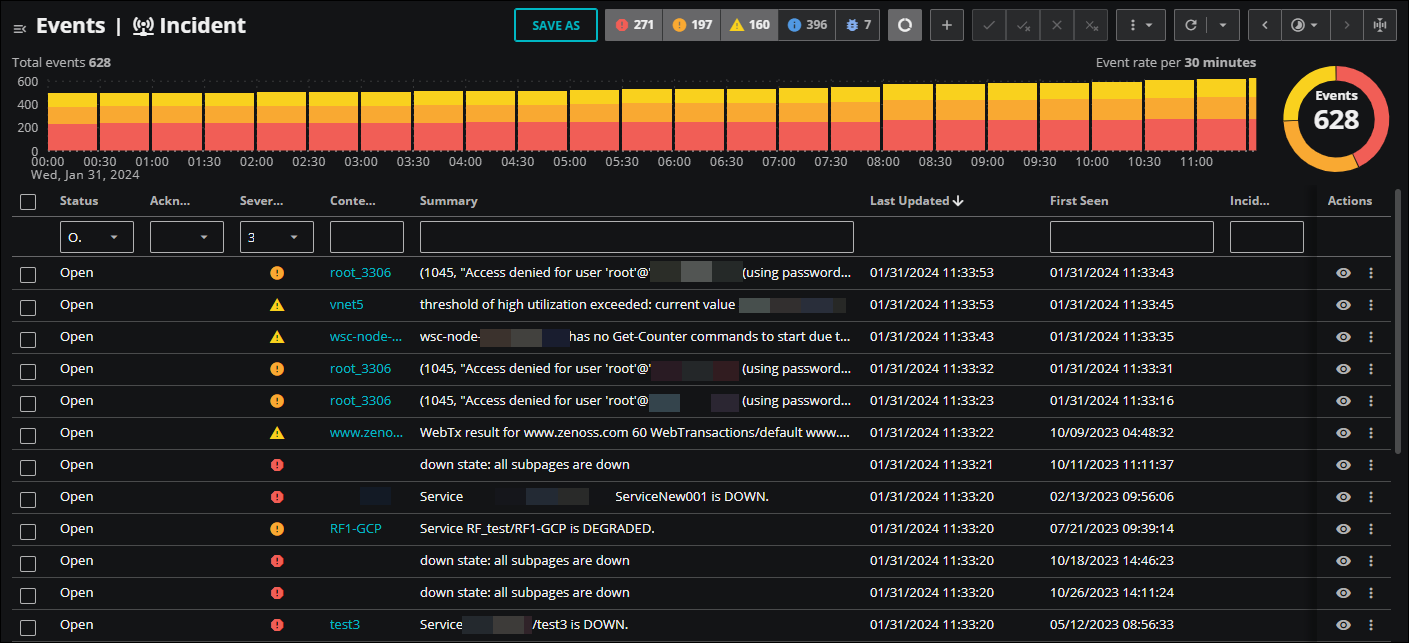
Similar to the column chart, the heat map is also divided into slices of the time range that contain the events as defined by their First Seen and Last Seen criteria.
For more information, see Events console.
Dashboards
The Dashboards view now includes the following enhancement:
-
Full-screen option for tiles: You can now enlarge an individual tile in your dashboard to fill the entire screen. This is useful when you want to examine tiles that contain long tables and extended details. To do so, open the options (three dots) menu on the tile and click Full screen.
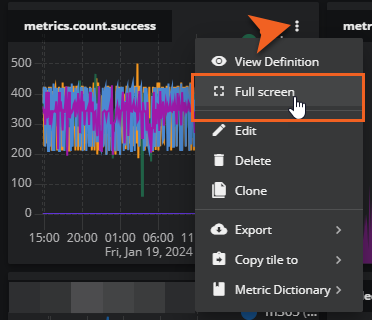
When finished, click X to close the full screen and return to your dashboard. For more information, see Dashboards.
Dictionary service
Dictionary service now includes the following enhancement:
-
Field type: When you add a new dictionary entry for an entity field or event field, or if you edit an existing entry, you can now specify field type. This is a required field.
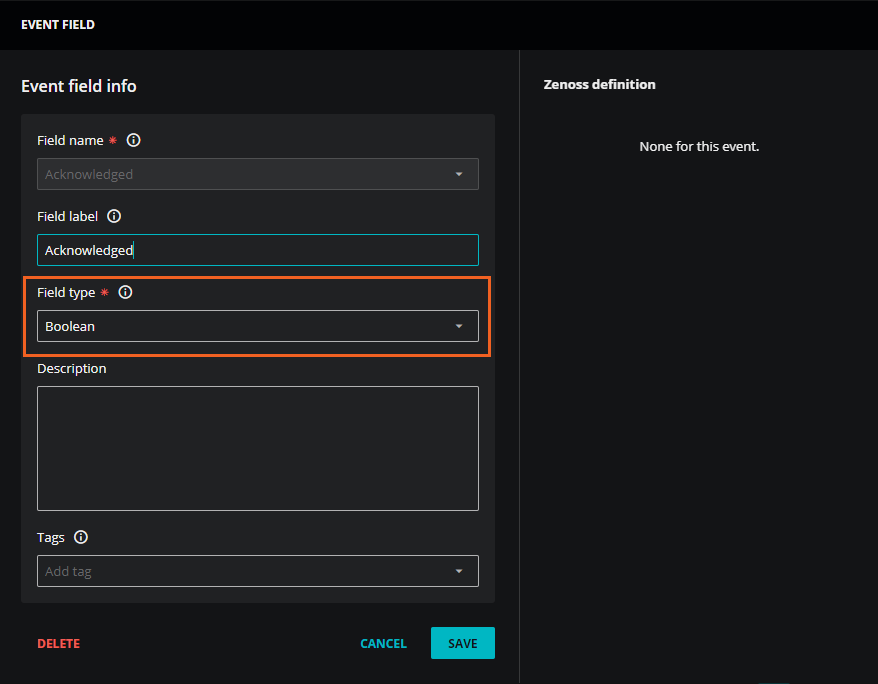
For more information, see Adding and editing dictionary entries.