Anomaly detection service
You can use the anomaly detection service to identify data points of a selected metric that fall outside the metric value's normal range. This feature is useful when you want to readily identify rare events or observations that deviate from an expected pattern in your data. After initiating the service, you can review results and take action across Virtana, including in Dashboards, Smart View, and Actions.
How does anomaly detection work? This service delivers accurate, precise, and near real-time results by leveraging a neural network algorithm, deep historical data, and frequent model training. When the service finds enough historical data for the metric, it starts training a model for that metric.
When a new data point arrives, the service compares the data point with the model and then scores it with a value between 0 and 1. A score of 0.0 is 100% normal and a score of 1.0 is 100% anomalous. Therefore, a score has to be greater than 0.99 to be considered an anomaly.
Using anomaly detection
To activate anomaly detection, select the metrics that you want to track by adding them to a custom anomaly policy, which initiates the training of anomaly detection models for these specific metrics.
Data modeling occurs on the 15th and 28th day of each month. When you first add a metric, wait until after the next 15th or the 28th day of the month for the initial model training to run for that metric. For metrics with high cardinality, model training can take a few days to complete. Existing models are retrained every 15th and 28th of the month on the latest collected metric data.
As a best practice to optimize model training, Virtana suggests that the metric include 30 days or more of collected data. Otherwise, model training may be skipped and retried at the next opportunity (the 15th or 28th day of the month), or you may end up with a model that is not reliable at identifying anomalies.
After an anomaly detection model exists, anomaly detection occurs continuously every time a value for that metric is ingested into Virtana Service Observability for any metrics associated with an enabled anomaly trigger. You can set up anomaly triggers in Actions to notify you when anomalous metric values are detected on a metric associated with a set of specific entities.
After the models are trained and you start receiving information about potential anomalies, you can view and act on results from the anomaly detection service in the following locations:
- On the Anomalies tile in Dashboards, view automatically highlighted anomalous entities.
- In Smart View, view anomaly visualizations and anomaly shields on metric cards.
- Use anomaly triggers in the Action service.
Adding a metric to anomaly detection
If you want to add a metric so the anomaly detection service trains models on it, perform the following procedures. For these tasks, your account must be assigned the Manager role.
Prerequisites
Before starting, do the following:
-
Identify the metric's source type. The source may be a Collection Zone, a Kubernetes agent, or any other custom data source in your environment. You don't need the name of the source, just the source type.
-
Identify the metric's name. You may know a metric by its display name, which Virtana Service Observability uses in dashboard and Smart View pages when a metric is included in the metric dictionary. For example, the display name for the
openstackQueues_perfQueueCountmetric is Perf Queue Count.
Process overview
First, determine if a custom anomaly policy exists for your metric's datasource, then either edit the existing custom policy or override the default policy.
Determine if a custom anomaly policy exists
-
Navigate to the ADMIN > Policy page, and then click the POLICIES tab.
-
In the Type column, select the Anomaly filter.
-
In the Datasources column, enter the datasource for your metric.
For example, for Collection Zones, enter
cz.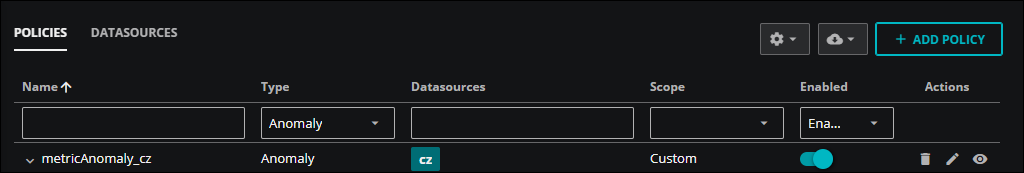
-
Do one of the following:
- If a custom policy exists, go to the next task.
- If no custom policy exists, go to the override the default policy task.
Edit an existing custom policy
-
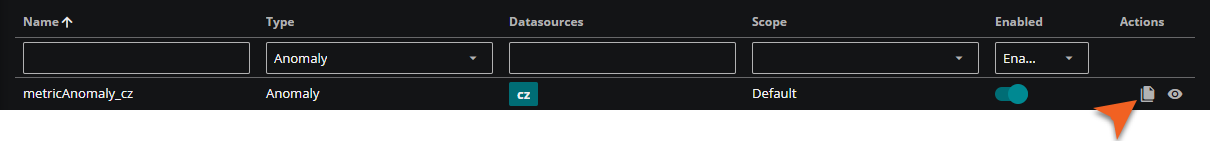
In the table of policies on the POLICIES tab, identify the custom policy.
-
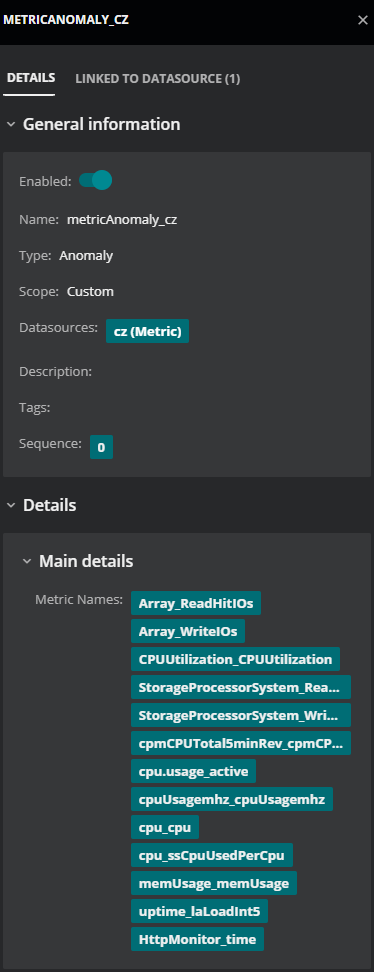
In the Actions column of the row of the policy to edit, click the Policy details icon.
-
Review the list of metrics in the Metric Names list and do one of the following:
- If the metric to add is in the list, stop.
- If the metric to add is not in the list, continue with this procedure.
-
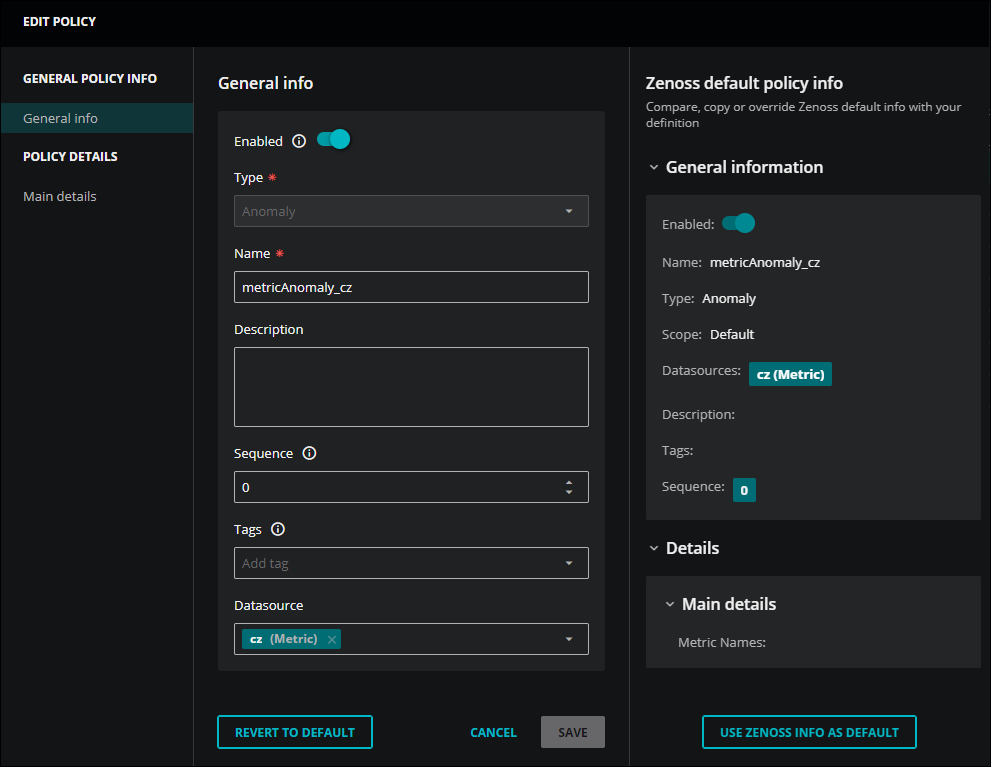
In the Actions column of the row of the policy to edit, click the Edit policy icon.
-
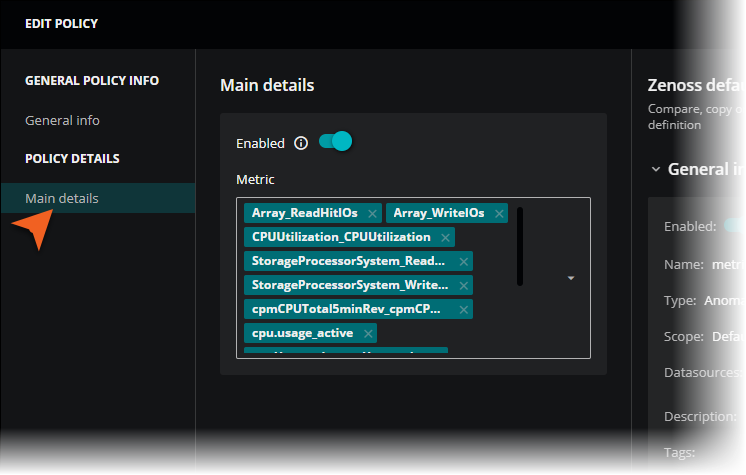
In the left column of the EDIT POLICY dialog box, click Main details.
-
Verify that the policy is enabled.
-
In the Metric field, enter the first few words of the name of the metric to add.
For example,
cpu.time.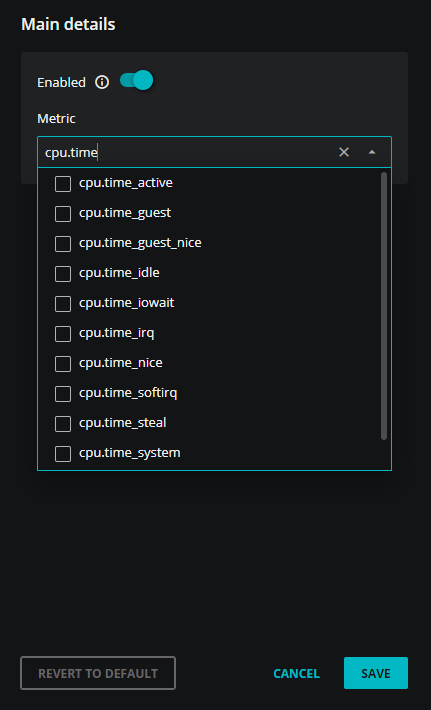
-
From the list of potential matches, select the metric to add, and then click SAVE.
Override a default policy
-
In the table of policies on the POLICIES tab, identify the policy to override.
-
In the Actions column of the row of the policy to override, click the Override policy icon and confirm that you want to override the default policy.
-
In the left column of the EDIT POLICY dialog box, click Main details.
-
Verify that the policy is enabled.
-
In the Metric field, enter the first few words of the name of the metric to add.
For example,
cpu.time. -
From the list of potential matches, select the metric to add, and then click SAVE.
Note
To revert a custom policy to the default policy, click Edit policy in the Actions column for the selected custom policy. In the EDIT POLICY dialog box that displays, click REVERT TO DEFAULT.