Service Impact
Service Impact provides two key functions that help you reduce the time it takes to uncover and fix issues, and to eliminate unforced outages. These functions are:
-
Root cause analysis identifies infrastructure dependencies that are supporting a service and how status and performance issues might be affecting the overall service.
-
Impact analysis identifies which services are affected by a particular piece of infrastructure.
Root cause analysis
For example, consider a service we’ll call Simple LAMP - a two tier web application service. The elements of the service are an Apache process serving web pages and a MariaDB database process that stores and retrieves dynamic data.
Here's a representation of Simple LAMP:
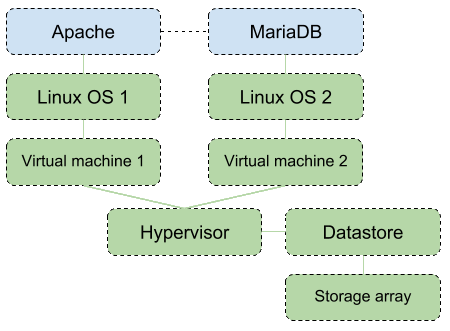
There's much more to it, of course. When we consider the infrastructure that these two applications rely on, the drawing gets more complex. The processes run on separate Linux operating systems, which might be running in virtual machines on one or more hypervisors, with backing storage provided by a storage array.
Here's a more realistic view of Simple LAMP:
Service Impact automatically builds and maintains a model of the relationship among the service elements and their infrastructure dependencies. For the Apache and MariaDB processes, the operating systems, virtual machines, hypervisor, datastore, and storage array are all dependencies. What happens if the two virtual machines move to a new hypervisor? Or a public cloud? Service Impact automatically adjusts its model to track the proper dependencies. You don’t have to make any configuration changes, as long as the new infrastructure is being monitored by Collection Zone.
If the Simple LAMP service isn’t acting properly, Service Impact can help you discover where faults originate. We call this root cause analysis. Here’s how it works.
Collection Zone routinely collects state change data and generates threshold events where performance metrics are out of the norm. Service Impact determines which state change and threshold events apply to the Simple LAMP service—including the dependencies and generates a state for the service. Each time the state of the service changes, Service Impact generates an event that you can use to generate a service ticket, send an email, or start corrective action (see Triggers and notifications).
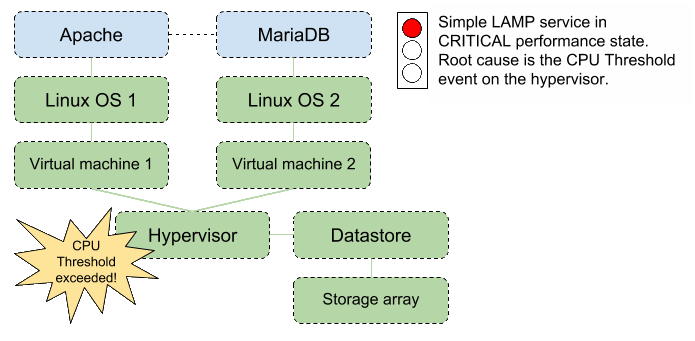
For example, let’s pretend that the Hypervisor doesn’t have enough CPU capacity to meet all the demand. Collection Zone generates a critical CPU Threshold Event for the hypervisor. Since everything in the Simple LAMP service relies on the hypervisor, Service Impact sets the state of the service to indicate that the service is in a critical performance state, and identifies the event on the hypervisor as the root cause of the event.
Here's an illustration of the hypervisor event:
Impact analysis
Impact Analysis helps teams identify whether any key services are being supported by a particular piece of infrastructure. This can prevent downtime caused by operational errors, such as forgetting to migrate virtual machines from a hypervisor before applying patches.
Once you’ve defined services for root cause analysis, impact analysis is
performed automatically. To see which services rely on a piece of
infrastructure, click on the Services view. In the following example,
nine services rely on the VMware host named ucs1-3-8-zenoss.loc.
Understanding service states
Service Impact uses Collection Zone events to determine the availability and performance states of services. From highest to lowest, the availability states are Up, Degraded, At Risk, and Down. Performance states are Acceptable, Degraded, and Unacceptable.
If there are no negative Collection Zone events for the elements or dependencies of a service, then the availability state is Up and the performance state is Acceptable. The following table summarizes the default policies for negative events:
| Service state type | Event class | Event severity | Service state |
|---|---|---|---|
| Availability | /Status/*(except /Status/SNMPand /Status/WMI) |
Critical | Down |
| Error | Degraded | ||
| Warning | At Risk | ||
| Performance | /Perf/* |
Critical | Unacceptable |
| Error | Degraded | ||
| Warning | Degraded |
Note that if an event has been generated for a component of a device (for example, a specific process), by default this event is not interpreted by Service Impact for the purposes of the device's availability or performance. In order for events related to a component to be interpreted by Service Impact, the component itself must be added to the service as an element. Administrators can identify the component that must be added by examining the component field of the event.
For example, assume that LinuxServerA is an element of a service called Wordpress Blog. If the HTTP process on LinuxServerA quits, a Collection Zone event is created, but Service Impact will not interpret that event for the purposes of LinuxServerA's availability or performance states, and therefore the event will not affect the availability or performance status of the Wordpress Blog service. If the administrators of Wordpress Blog decide that the HTTP process on LinuxServerA is indeed a dependency of the Wordpress Blog service, they must add the HTTP process on LinuxServerA as an element of the Wordpress Blog service in Service Impact.
Viewing service states
You can see the current service state in multiple places. Availability and performance states are displayed in a Service Health indicator. This example service is At Risk for availability and Acceptable for performance.
Service Dashboards provide a convenient way to see the status of multiple services concurrently. To see these dashboards, select Dynamic Services or any Service Organizer under the Impact tab.
Service Impact events
When a service's availability or performance state changes, Service Impact sends an event to Collection Zone. The following table summarizes the default policies for negative state changes:
| Service state type | Event class | Service state | Event severity |
|---|---|---|---|
| Availability | /Service/State/Availability |
Down | Critical |
| Degraded | Error | ||
| At Risk | Warning | ||
| Performance | /Service/State/Performance |
Unacceptable | Critical |
| Degraded | Error |
You can use the triggers and notifications feature of Collection Zone to let someone know that a service has changed state, to create a service desk ticket, or to generate an automated response.
State propagation policies
State propagation policies for a dynamic service context determine how the Availability and Performance state of an entity's node and the nodes it impacts change because of events being received to that entity.
When new events occur against a service model member (device, component, component group, logical node, organizing group, or dynamic service) Service Impact identifies all the service contexts in which that member participates. For each service context, Service Impact performs the following processing:
- Applies the combination of global, service, and node context policies to decide the state of that member in this service context.
- If the combination of policies indicate that the event should be propagated further within the service context, looks up all impact dependency relationships that exist for other nodes in the same service context. Different relationships can exist in other service contexts.
- Applies the service context polices to each of those nodes to compute their new state in the service context and decide whether to continue propagating further. Propagation of state change and event continues until all state and event propagations are completed.
- If any path through the impact graph affects the dynamic service itself, generates a service event. The service event includes details about the path from the event to the service model member through the impact graph to reach the dynamic service. Multiple paths through the graph from a single member's event might reach the dynamic service node, and multiple concurrent events to different members. Therefore, details of a service event include the union list of all service event paths and a probability ranking of which path and originating member event is the root cause.
For a service model member that you use only to group child members, you can suppress sending service events.
You can create and assign multiple policies to any service member. In the Impact View, to select the type of policy that you want to create, edit, or view, select the Availability aspect or the Performance aspect.
The policy type that is applied to the members determines which members receive the data. The policy types, in order of precedence are as follows. For more information about state symbols and borders that are shown in the examples, see Actual and derived state.
-
A contextual policy propagates the member's state change only to its immediate parent members within the current service context.
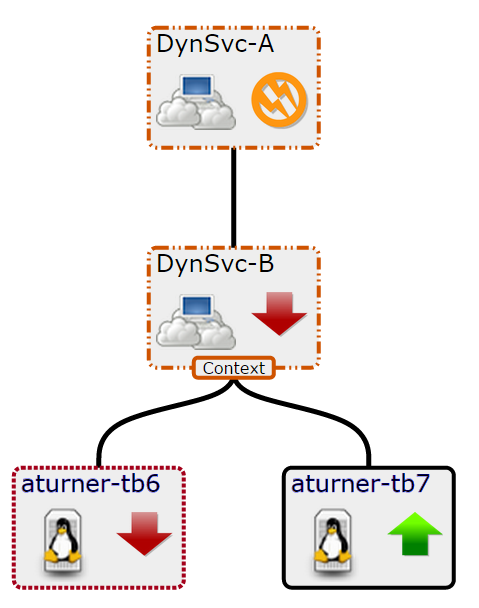
In the following example graph, a contextual policy is applied to the service model for Dynamic Service B (DynSvc-B). The policy states that if one child member is down, then the state of DynSvc-B must be degraded.
-
A global policy applies to all service model contexts that share an member that has a changed state. For example, if a global policy is applied to a member in a service model, and a child member has a change to its state data, the new state is propagated to the parent members in all service models to which the member belongs.
The following example graph shows that DynSvc-D is used in two different service models: DynSvc-C and DynSvc-E. The global policy propagates the degraded state to all service contexts of which DynSvc-D is a member.
-
A member with the default policy sends the state data of the worst condition affecting it to its parent member. The default policy is negated if you add either a contextual or global policy to a service model.
In the following example graph, no policy is applied to DynSvc-B. Its state is down because that is the worst case of its children.
If multiple policies are applied to a member, then the following overrides occur:
- A contextual policy overrides a global policy.
- Contextual and global polices override the default policy.
Actual and derived state
Each in a service model has an actual state and a derived state.
A device element's actual state is determined by events that occur on the device, regardless of the service models in which it participates. A service model member's actual state is generated from the service model in its own service context. The element's derived state is generated from policy propagation within a given context. In the Service Impact graph, the symbol that appears inside the node's border reflects the actual state; the border that outlines the node reflects the derived state.
In the following example graph, the actual and derived states are down. The parents of the device have a degraded and at-risk actual state, yet the derived state based on the contextual policy, is degraded.
Visual state indicators
The Impact View provides symbols and borders to visually indicate availability, actual state, performance, and derived state, as shown in the following table.
| Availability | Performance | Symbol / Actual State | Border / Derived State |
|---|---|---|---|
| UP | ACCEPTABLE |
|
|
| ATRISK | Not applicable. |
|
|
| DEGRADED | DEGRADED |
|
|
| DOWN | UNACCEPTABLE |
|
|
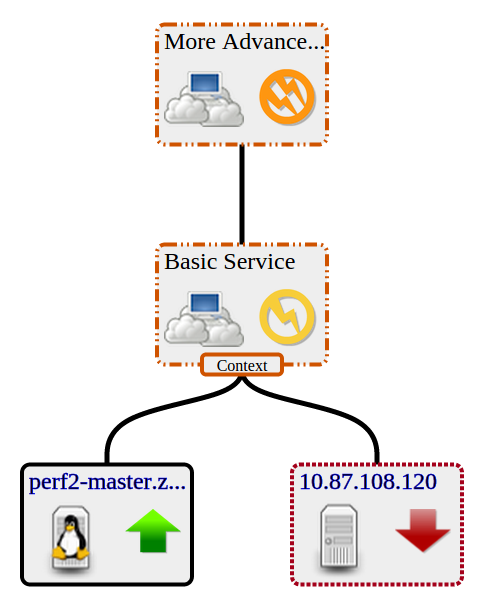
A member's actual and derived states can be different. As shown in the following example, a service's actual state can be up, but an applied context policy changed its derived state to down.

