CPU Utilization
Shows monitored devices, load averages, % utilization, and forecasted exhaustion. You can customize start and end dates.
Report filtering
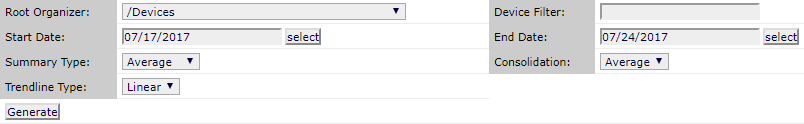
- Root Organizer
- The device class to use for filtering. The default is /Devices.
- Device Filter
- Enter the name of the device to filter by.
- Start Date / End Date
- The first and last dates of the range of dates to include in the report. To select a date from a calendar, click select. The default range is the week ending with the current date.
- Summary Type
- Possible values include: Average, Maximum, Minimum, and Last.
- Consolidation
- Possible values include: Average and Max.
- Trendline Type
- Projection algorithm used in Forecasted % Util Exhaustion calculation. Possible value: Linear
To generate or refresh the report, click Generate.
Note: If you export the report by clicking Export all, be sure to format the percentage columns to show percentages instead of decimal values.
This report uses data point aliases. To add data points to a report, add the alias, and then ensure the values return in the expected units.
| Alias | Expected Units |
|---|---|
| loadAverage5min | Processes |
| cpu_pct | Percent |
Report contents
| Column | Content |
|---|---|
| Device | Name of the device based on the filter parameters selected. |
| Load Avg | Average load on the device. |
| % Util | % CPU utilization on the device |
| Forecasted % Util Exhaustion | The amount of time before the exhaustion threshold will be breached. |