Aggregate Bandwidth Utilization
A summary of the aggregate throughput shown per chassis, per fabric extender, and per I/O module for each domain. Three graphs are shown per domain. You can see the individual components of these graphs on the particular device's component page.
For example, to see the throughput on fex-2 of a particular device, you would click INFRASTRUCTURE, then click the device name and select Fabric Extenders from the Components list. Click fex-2 to display the graph of the throughput in the bottom pane. This represents this fabric extender's part in the total throughput displayed in this report.
Report filtering
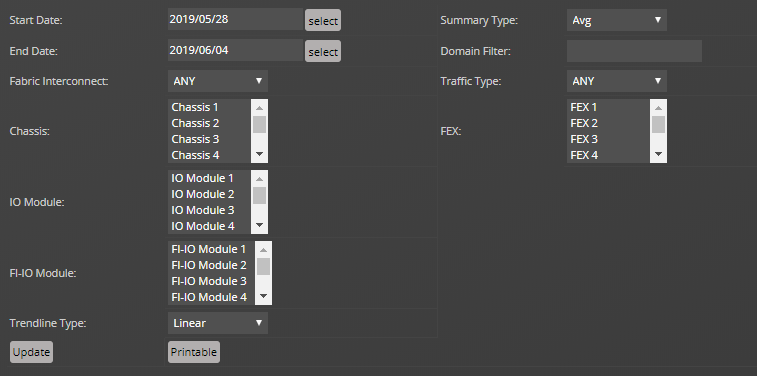
The following fields filter the results.
- Start Date / End Date
- The first and last dates of the range of dates to include in the report. To select a date from a calendar, click select. The default range is the week ending with the current date.
- Summary Type
- The type of summary that is to be displayed. Average is based on the 15-minute data collection, while Max is only taken once a day.
- Domain Filter
- A substring search of domains to include. A partial name matches all interface names that include it. You may also use a regular expression for this filter.
- Fabric Interconnect
- Select the FI to filter by.
- Traffic Type
- Type of traffic to display. Choose from ANY, Tx or Rx.
- Chassis, FEX, IO Module, Shared Adaptor, FI-IO Module
- Select the items to filter by. You can multi-select by CTRL-clicking your selections.
- Trendline Type
- The calculation used to determine the trendline. Only available selection is Linear.
To generate or refresh the report, click Update.
To generate a printable version of the report, click Printable, then use the print functionality on your browser.
The following are some example scenarios that may be seen in graphs along with their corresponding description:
- If a graph shows 16.48 G (Current value) for Chassis-3, it is the aggregate (or sum) of Receiving (Rx) and Sending (Tx) bits of Chassis-3.
- If a graph shows 1.89 M (Max value) for Fex-2, it is the aggregate (or sum) of the Receiving (Rx) and Sending (Tx) bits that happens on the ports connected to Fex-2.
- If a graph shows 17.15 G (Average value) for an IO module (for example, Chassis-1_slot-1), it is the aggregate (or sum) of Receiving (Rx) and Sending (Tx) bits that are transferred specifically to the IO module.