Metric Outliers tile
The Metric Outliers tile provides a quick way to identify entities which have metric data points that exceed one or more thresholds.
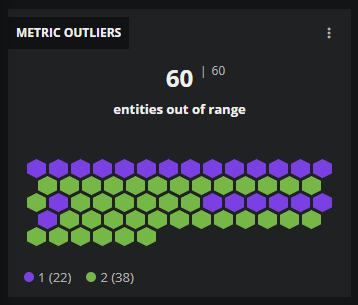
This tile uses color-coded hexagons to represent entities and arranges entities in alphabetical order. You choose the metric to observe and the colors to associate with each threshold. Entities within the dashboard scope that collect the chosen metric are included in the tile.
- When you hover over a hexagon, Virtana Service Observability displays the entity's name and its current value.
- When you click a hexagon, Virtana Service Observability opens the entity's Smart View.
Example tile
Configure your tile
When editing a dashboard, click the Add tile button to open the AVAILABLE TILES panel, then select the Metric Outliers tile. The METRIC OUTLIERS panel opens.
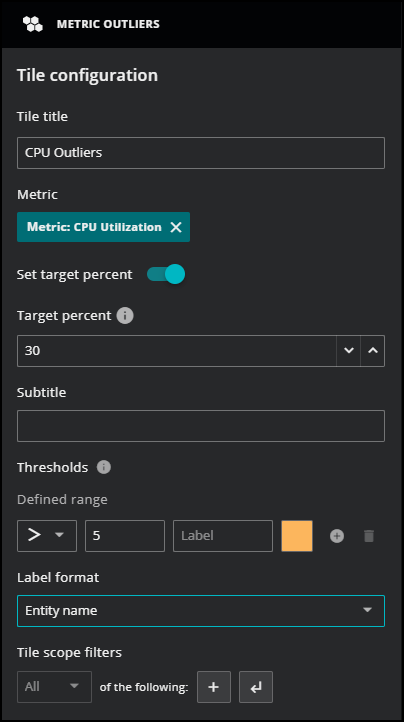
Tile configuration options
- Tile title
- The text that appears in the upper-left corner of a tile.
- Metric
-
The name of the metric to observe.
The field suggests metric names as you enter text. Select one from the list of names.
- Set target percent
-
Choose if you want to apply a target percentage of time or not when a metric exceeds the specified thresholds. By default, this option is turned off.
-
When set to off, you can’t set "Target percent" and only the most recent metric value is considered for thresholds.
-
When turned on, you must enter a "Target percent" value that determines if the most recent value exceeds the threshold for the specified percentage of the time range.
-
- Target Percent
- The percentage of the dashboard's current time range in which a metric's data points must meet the defined threshold or thresholds. To set this value, you must turn on Set target percent.
- Subtitle
- The text that appears immediately below the entity counts.
- Thresholds
-
Specify the following fields to set one or more threshold criteria with a corresponding color for representing the entity status. For more information, see Threshold evaluation.
Comparison operator Set the comparison operator for the threshold evaluation, such as "less than" or "greater than or equal to."
Threshold value The data point value to use in the comparison. Label (Optional) Enter the descriptive text for the threshold that appears in the legend at the bottom of the tile.
The default label is the comparison operator and threshold value followed by the count of entities that satisfy the threshold in parentheses.
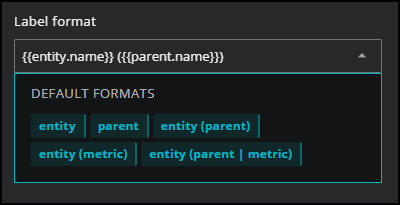
Color The color to fill the hexagons of entities that have data points that satisfy the threshold. - Label format
-
The content to include in hover text. Depending on which aggregator you choose, a different default label format is used and different default label formats are available. This field uses the mustache template system.
If needed, you can enter your own label format in the field by using any combination of metric, entity, and parent entity fields. These can either be entered into the box or selected from the provided list. As you enter text, the list is filtered to only fields that match what you entered.
For example, if you want to identify your open telemetry data for a specific metric, you can enter different values in this field using the mustache template system to help you identify the metric metadata in your hexagons. Entering two open braces (
{{) allows for auto-completion of variables. - Tile scope filters
-
(Optional) Create a specific filter just for the tile. This is useful if you need to compare different services side-by-side. For example, maybe you want to compare the performance of your services in different regions.
Use the query builder to create and apply a filter to the tile:
-
Click the + (plus sign) to add a clause.
-
To define the clauses, click in the first field to select an entity field. This field offers suggestions based on the user-friendly names in the Dictionary or from live data in your system.
-
Select your operator, then select your value. Start typing in the value field for autosuggestions based on your selected entity field.
-
To add another simple clause or add a compound clause, use the buttons in the top of your query. To remove all the clauses, click the X button in the top of the query.
-
Understanding threshold evaluation
Thresholds are evaluated in the order in which they appear in the tile configuration dialog box, and evaluation stops when a threshold's criteria are satisfied.
For example, consider an entity with a data point of 50 and the following threshold configuration:
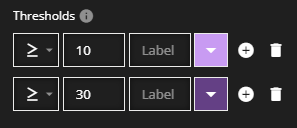
While 50 exceeds both 10 and 30, evaluation stops at 10 and the entity's hexagon is filled with the Plum Lighter color.