Thresholds
Thresholds define expected bounds for data points. When the value returned by a data point violates a threshold, the system creates an event. There are several threshold types available:
- MinMax
- PredictiveThreshold
- ValueChange
- CiscoStatus
There are many thresholds already defined in the system. You can see all the defined thresholds in the Defined Thresholds report which can be accessed on the REPORTS > Enterprise Reports menu.
The following sections describe each type of threshold and how to create a new one and edit an existing one.
Additional threshold types may be provided through installed ZenPacks.
Adding thresholds
To define a threshold for a data point:
- From the Navigation menu, select ADVANCED > MONITORING TEMPLATES.
- Click on the template that contains the data point you want to use in your threshold.The Data Sources window is populated with folders containing all the data points being collected.
- Select the data point by opening the appropriate folder in the data source and clicking on the data point row.
- In the Thresholds area, click the Add icon. The Add Threshold dialog box appears.
- Enter a name and select the threshold type, then click Add. The threshold name and type is displayed in the Thresholds window.
MinMax threshold
MinMax thresholds inspect incoming data to determine whether it exceeds a given maximum or falls below a given minimum. You can use a MinMax threshold to check for these scenarios:
- The current value is less than a minimum value. To do this, you should set only a minimum value for the threshold. Any value less than this number results in creation of a threshold event.
- The current value is greater than a maximum value. To do this, you should set only a maximum value for the threshold. Any value greater than this number results in creation of a threshold event.
- The current value is not a single, pre-defined number. To do this, you should set the minimum and maximum values for the threshold to the same value. This will be the only "good" number. If the returned value is not this number, then a threshold event is created.
- The current value falls outside a pre-defined range. To do this, you should set the minimum value to the lowest value within the good range, and the maximum value to the highest value within the good range. If the returned value is less than the minimum, or greater than the maximum, then a threshold event is created.
- The current value falls within a pre-defined range. To do this, you should set the minimum value to the highest value within the bad range, and the maximum value to the lowest value within the bad range. If the returned value is greater than the maximum, and less than the minimum, then a threshold event is created.
Editing MinMax thresholds
The threshold must be created by the Add Threshold functionality or already be defined in the system before you can edit it.
To edit a MinMax threshold:
-
Double-click the threshold in the list.
-
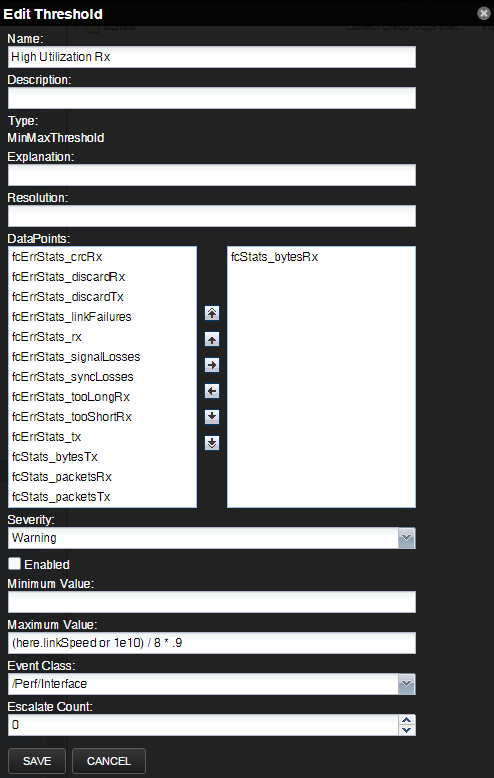
Enter or select values to define the threshold:
-
Name- Displays the value for the ID you entered on the Add a New Threshold dialog box.
-
Description- Description of the threshold that you entered on the Add a New Threshold dialog box. The description is included in each event that is created from this threshold.
-
Type- Type of threshold that you selected. You cannot change the type of threshold. If you want a different type of threshold, you need to create a new one and assign the correct type.
-
Explanation- Information field where a user can enter information about what the event means. This field is included in each event that is created from this threshold
-
Resolution- Information field where a user can enter information about what to do to resolve the event. This field is included in each event that is created from this threshold.
-
Data Points- Select one or more data points to which this threshold will apply and click the right-arrow button to move them to the selected column.
-
Severity- Select the event severity level of the first event triggered when this threshold is breached.
-
Enabled- Select the check box to enable the threshold, or clear the check box to disable it.
-
Minimum Value- If this field contains a value, then each time one of the selected data points falls below this value an event is triggered. This field may contain a number or a Python expression. When using a Python expression, the variable
herereferences the device or component for which data is being collected. For example, a 90% threshold might be specified as:(here.linkSpeed or 1e10) /8 * .9The division by 8 is needed because interface speed frequently is reported in bits/second, where the performance data is bytes/second.
-
Maximum Value- If this field contains a value, then each time one of the selected data points goes above this value an event is triggered. This field may contain a number or a Python expression.
-
Event Class- Select the event class of the event that will be triggered when this threshold is breached.
-
Escalate Count- Enter the number of consecutive times this threshold can be broken before the event severity is escalated by one step. A value of zero (0)indicates that the severity will not escalate.
- Click Save to confirm the edits.
-
Predictive threshold
The Predictive threshold allows you to use data from the past to project a value in the future and send an event if the future projected threshold is breached during a pre-defined time period. Resource Manager uses a linear projection algorithm for all projections. For example, you could predict total raw storage capacity of a disk or the bandwidth utilization percentage. Several predictive thresholds are already defined in the system. You can see all the defined thresholds in the Defined Thresholds report which can be accessed on the REPORTS > Enterprise Reports menu.
Predictive thresholds are also used for creating a trendline on a graph. You can add the threshold to the management of graph points so that a trendline will be added to the graph.
Editing Predictive Thresholds
The threshold must be created by the Add Threshold functionality or already be defined in the system before you can edit it.
-
Double-click the threshold in the list.
-
Enter or select values to define the threshold:
-
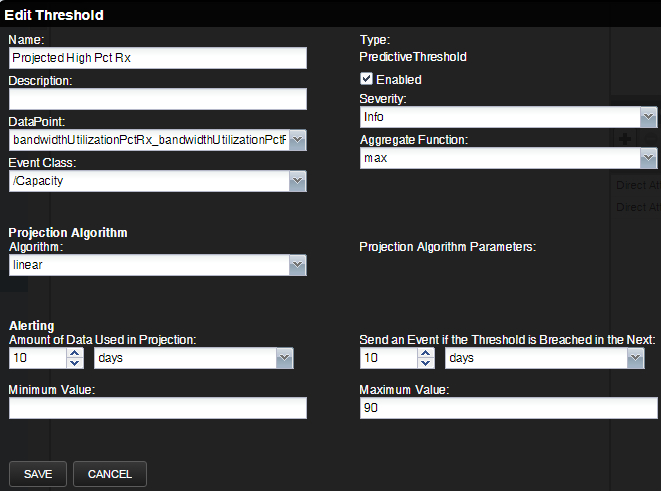
Name- Displays the value for the ID you entered on the Add a New Threshold dialog box.
-
Description- Description of the threshold that you entered on the Add a New Threshold dialog box. The description is included in each event that is created from this threshold.
-
Data Point- Select the data point to which this threshold will apply.
-
Event Class- Select the event class of the event that will be triggered when this threshold is breached.
-
Type- Type of threshold that you selected. You cannot change the type of threshold. If you want a different type of threshold, you need to create a new one and assign the correct type.
-
Enabled- Select the check box to enable the threshold, or clear the check box to disable it.
-
Severity- Select the severity level of the first event triggered when this threshold is breached.
-
Aggregate Function- The type of function to use when analyzing the past data. For example, do you look at the peak values in the past or average values. The default value is max.
-
Algorithm- Algorithm to use for the projection. Value is linear.
-
Projection Algorithm Parameters- Some algorithms need additional parameters.Enter them as required.
-
Amount of Data Used in Projection- Set the amount of historical data to be used when calculating the projection.
-
Send an Event if the Threshold is Breached in the Next- Set the time frame in days, weeks, or months. If the threshold is breached within this time period in the future, an event will be sent.
-
Minimum Value- If this field contains a value, then each time one of the select data points falls below this value an event is triggered. This field may contain a number or a Python expression. An expression is required when using gauge or calculated values. When using an expression, the variable here references the device or component for which data is being collected. For example, a 90% threshold for interface speed might be specified as:
(here.linkSpeed or 1e10) /8 * .9The division by 8 is needed because interface speed frequently is reported in bits/second, where the performance data is bytes/second.
-
Maximum Value- If this field contains a value, then each time one of theselected data points goes above this value an event is triggered. This field may contain a number or a Python expression. An expression is required for gauge or calculated values.
-
-
Click Save to confirm the edits.
Adding a trendline to a graph
Trendlines show you the projected utilization of a device or component over a specified range of time. The following procedure is tailored to be performed on a CiscoUCS device. In order to add a trendline to a graph, the threshold that you want to use must already be created in the system.
To add a trendline to an existing graph:
-
Navigate to INFRASTRUCTURE > Devices, then select a CiscoUCS device.
The selected device's overview page appears.
-
From the device's left panel, select Chassis, and then select a chassis from the Chassis list.
-
Change the Display drop-down menu from Graphs to Templates.
-
In the Graph Definitions section, click the Add graph definition (+) button.
-
In the Add Graph Definition dialog box, enter a name for the graph.
Alternatively, click the name of an existing graph to add the trendline to that graph.
-
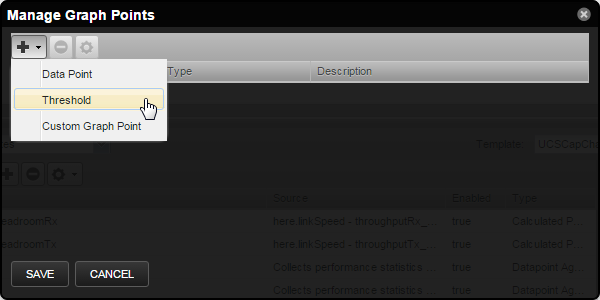
Select the new graph, then from the gear icon, select Manage Graph Points.
The Manage Graph Points dialog box appears.
-
Click + > Threshold.
-
Select the name of the new predictive threshold and click Submit.
-
In the Manage Graph Points dialog box, click Save.
-
To view the trendline, change the Display drop-down menu from Templates to Graphs.
-
Scroll down to the new or existing graph to view the newly added trendline.
Note
By default only the last 10 days of data is used in the trendline calculation. There might not be enough data to see the trendline appear on the graph. However, you can view the projected exhaustion dates in the lower right corner.
ValueChange threshold
ValueChange thresholds inspect incoming data to determine whether a status change has occurred and if so issues an event based on the defined severity.
Editing ValueChange thresholds
The threshold must be created by the Add Threshold functionality or already be defined in the system before you can edit it.
To edit a ValueChange threshold:
-
Double-click the threshold in the list.
-
Enter or select values to define the threshold:
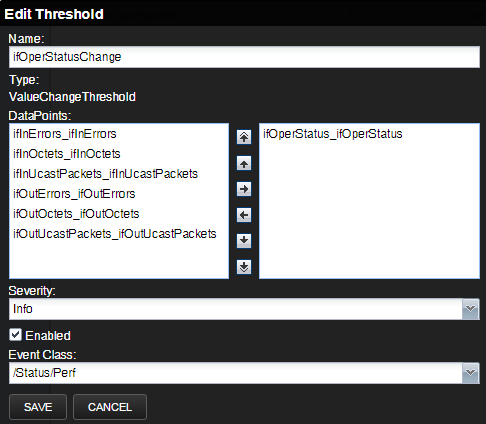
- Name- Displays the value for the ID you entered on the Add a New Threshold dialog box.
- Type- Type of threshold that you selected. You cannot change the type of threshold. If you want a different type of threshold, you need to create a new one and assign the correct type.
- Data Points- Select one or more data points to which this threshold will apply and click the right-arrow button to move them to the selected column. When the datapoint changes status, an event will be triggered.
- Severity- Select the severity level of the first event triggered when this threshold is breached.
- Enabled- Select the check box to enable the threshold, or clear the check box to disable it.
- Event Class- Select the event class of the event that will be triggered when this threshold is breached.
- Click Save to confirm the edits.
CiscoStatus threshold
The CiscoStatus threshold is a special threshold that uses preconfigured maps to translate the numeric values returned by SNMP data sources to Collection Zone event severities. The following is an example OID and its mapped values.
Note
Certain pre-configured CiscoStatus thresholds have no configured value for their event class. This is by design and should not be altered.
These thresholds make use of the event class key and a combination of event class mappings and event transform code to assign generated events to the appropriate event class.
CISCO-ENTITY-FRU-CONTROL-MIB::cefcModuleOperStatus
| OID value | Description | Collection Zone severity level |
|---|---|---|
| 1 | unknown | Critical |
| 2 | OK | Clear |
| 3 | disabled | Clear |
| 4 | OK (diag failed) - | Warning |
| 5 | boot | Warning |
| 6 | self-test | Warning |
| 7 | failed | Critical |
| 8 | missing | Critical |
| 9 | mismatch w/parent | Critical |
| 10 | mismatch w/config | Critical |
| 11 | diag-failed | Critical |
| 12 | dormant | Critical |
| 13 | out of service (admin) | Info |
| 14 | out of service (environ) | Critical |
| 15 | powered down | Critical |
| 16 | powered up | Critical |
| 17 | power denied | Critical |
| 18 | power cycle | Warning |
| 19 | OK (power warning) | Warning |
| 20 | OK (power critical) | Critical |
| 21 | sync in progress | Clear |
| 22 | upgrading | Critical |
| 23 | OK (auth failed) | Critical |
For the complete list of supported OIDs and values, refer to the CiscoStatus Threshold page.
For more information about event severity levels, see Event severity levels.
Editing CiscoStatus thresholds
The threshold must be created by the Add Threshold functionality or already be defined in the system before you can edit it.
Note
Certain pre-configured CiscoStatus thresholds have no configured value for their event class. This is by design and should not be altered.
These thresholds make use of the event class key and a combination of event class mappings and event transform code to assign generated events to the appropriate event class.
To edit a CiscoStatus threshold:
-
Double-click the threshold in the list.
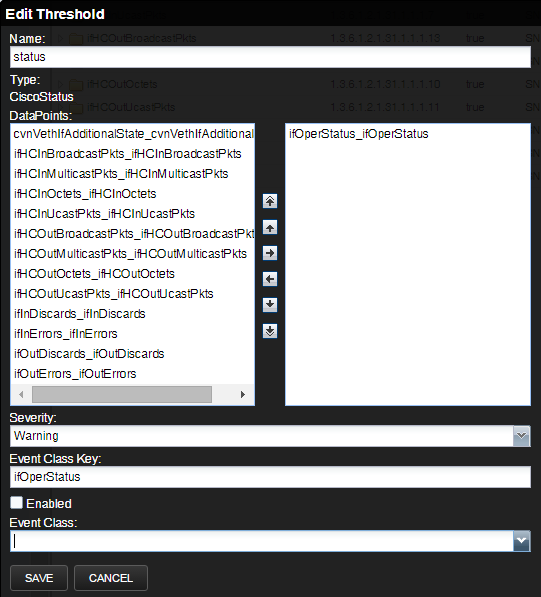
-
Enter or select values to define the threshold:
- Name- Displays the value for the ID you entered on the Add a New Threshold dialog box.
- Type- Type of threshold that you selected. You cannot change the type of threshold. If you want a different type of threshold, you need to create a new one and assign the correct type.
- Data Points- Select one or more data points to which this threshold will apply and click the right-arrow button to move them to the selected column. When the datapoint changes status, an event will be triggered.
- Severity- Select the severity level of the first event triggered when this threshold is breached.
- Event Class Key- The event class key from the data point you selected will be shown here.
- Enabled- Select the check box to enable the threshold, or clear the check box to disable it.
- Event Class- Select the event class of the event that will be triggered when this threshold is breached.
- Click Save to confirm the edits.