Defining dashboard scope
You can define the dashboard scope in several ways. You can define the set of entities a dashboard includes, apply additional filters to that scope, and choose a scope type for the dashboard.
Set dashboard scope type
You can choose current or historical scope for a dashboard. For more information, see Dashboard scope.
-
Display a dashboard that you own.
-
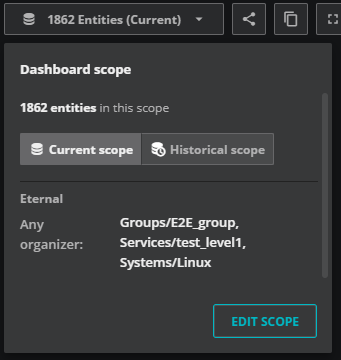
Open the Dashboard scope panel by clicking the scope control.
-
Click Current scope or Historical scope.
-
To close, click outside the panel.
Edit the dashboard scope
You can edit the scope of your dashboard. This is useful when you want to adjust the entities included in your current scope or if you want to modify or delete filters you have applied.
-
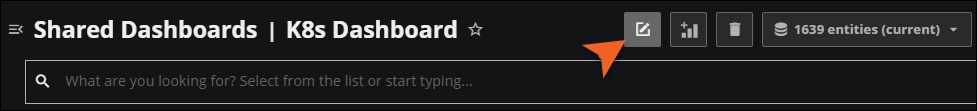
In your dashboard, open the Dashboard Scope panel by clicking the scope control.
-
Click EDIT SCOPE. The Define Dashboard Scope page opens.
-
Add, modify, or delete the entities and filters in the current queries. Be sure to save in each section as you make your changes.
-
Click SAVE to return to the dashboard.
For more information about defining the dashboard scope, including using a query to define entities, see Create a new dashboard.
Filter the dashboard scope
You can further refine the scope of your dashboard using the scope filter to help you in your investigations. For example, you might have a dashboard monitoring 10,000 devices, and you receive an error on device "X". To reduce the scope of your dashboard, open the scope filter bar and build a query, such as "name contains X".
The Expand scope filter bar opens the query builder where you can specify the criteria of the entities you want to view. As you enter text, the scope filter bar suggests options for each part of the query, including property names, operators, values, and connectors. If needed, use the autocomplete dropdowns to change a part of the query.
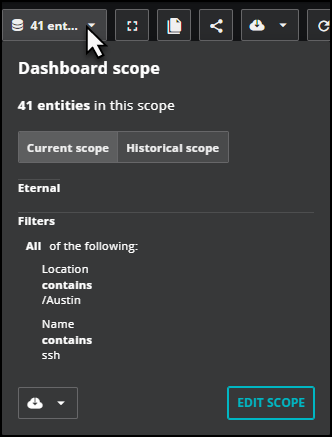
To keep this filter as part of your dashboard scope, click the Save icon in the query bar. When you do save this filter, you can view it as part of the Dashboard scope. Select the scope control to view the scope and its filters.
To create a filter for your dashboard, do the following:
-
Display a dashboard that you own.
-
Click Expand scope filter bar to open a query builder.
-
Select a property. Enter text and select a field in the dropdown menu.
-
Select an operator in the dropdown menu, then enter a value.
-
Optionally, build a more targeted query. Choose between AND and OR to join another property-value comparison. The dashboard displays data matching the filtered scope.
-
When you're finished viewing the refined dashboard, click the Save icon in the query bar to keep this filter as part of your dashboard scope, or click the X icon to clear the scope filter bar and return to the dashboard scope.
Note
When you save the scope filter, you can view it in the Dashboard scope panel. If you want to edit or remove the filter for this dashboard, click EDIT SCOPE in the Dashboard scope panel.
-
Click the scope filter button again to collapse the query bar.
Note
When you collapse the scope filter, you hide the query bar. However, any applied filters remain active until you clear the query bar by clicking the X icon. Alternatively, you can navigate away from the dashboard to clear its scope filters.
In addition to setting filters for the dashboard scope, you can also set filters on select tile types. Learn more.