Events
Virtana Service Observability includes a rich variety of features and tools for managing, monitoring, analyzing, and creating events. While events are included in dashboards and Smart View pages, the main location for managing events is the Events console.
An event is a record that indicates a notable change in the state of a resource, such as if a device is exceeding a CPU threshold or a server is down. This record is sent to the event processing service. Events can be external or internal.
-
External events can be solicited, for example, through ZenPacks, or unsolicited, such as through SNMP traps or syslog.
-
Internal events are created in response to failed pings, threshold evaluations, and other occurrences.
You can view open and closed events in the Events console.
Viewing and managing events
In the Events console, you can view events associated with all entities in the current time range and access the tools for managing events. For example, to help in your event analysis, you can select two to four events and compare them side-by-side, or you can view the details of a single event.
When you initially open the Events console, you see the latest event information. You can switch to Advanced mode to access more filtering, sorting, and visualization options.
Learn more about the Events console.
In addition, there are several resources for helping you manage events:
-
As an administrator, you can manage your system’s event ingest by creating specific rules called event policies. You can use event policies to drop events you don’t need or transform the formats for a defined set of events. Event Management provides an easy-to-use console where you can control the application of policies and stop the flow of specific policies as needed. Learn more about Event Management.
-
The Virtana Service Observability API includes event management resources for updating and annotating events.
Events and Dictionary service
You can create more user-friendly field names in the Dictionary service, which provides more readable or compact alternatives to computer-generated event field names and detailed descriptions of the fields. Dictionary entries are used wherever event field names are displayed.
Learn more about events in Dictionary service.
Events and Dashboards
You can use dashboards to monitor events. Dashboards provide tiles and options that enable near real-time event monitoring of specific entities or groups of entities. To configure a dashboard for near real-time monitoring, you can set its time range to the last hour or 3 hours, for example, then set its refresh interval to 1 minute or 3 minutes.
To investigate conditions in the past, dashboard time ranges can be set to any arbitrary value within your data retention period.
Note
For specific details about your organization’s data retention period, contact your Virtana Support representative by opening a support ticket.
The following dashboard tiles can help you monitor events:
-
The Event List + Count tile combines the displays a doughnut chart, a table of events, or both.
-
The Map tile displays the location organizers in a dashboard's scope on an interactive map. If an organizer contains entities and the entities have events during the current time range, the tile displays a doughnut chart representing the events.
-
The Top Event Producers tile displays the count of events and the names of the entities that have the greatest number of events reported against them.
Learn more about monitoring events in Dashboards.
Events and Smart View
You can analyze large or small groups of events and individual events. Smart View pages can include events associated with an entity and its related entities for analyzing patterns during root cause investigations.
Learn more about events in Smart View.
Creating events
There are several ways to create events in Virtana, including programmatically, through the API, and manually.
Most events are created programmatically. Use the action service to create events by specifying an event destination.
The Virtana Service Observability API includes a resource for sending events to Virtana Service Observability. Also, the Collection Zone API provides a resource of sending events.
Additionally, you can manually create events in the Events console.
Create events in the Events console
You can manually create events in the console for testing event mappings, event transformations, and triggers and notifications.
Note
Your account must be assigned the User or Manager role to create events.
To create an event, perform the following steps:
-
Log in to Virtana Service Observability as a user with the User or Manager role, and then click EVENTS. The Events console opens.
-
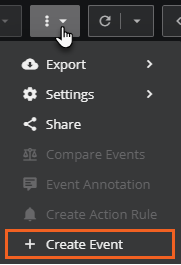
In the toolbar, click the Create Event (plus sign) button to add an event. The Create Event dialog box opens.

If you don't see the Create Event button in the toolbar, try clicking the Action options (vertical ellipse) button and then select Create Event in the menu that appears.
-
In the General Information section of the Create Event dialog box, add the following information. The red asterisk in the dialog box indicates a required field.
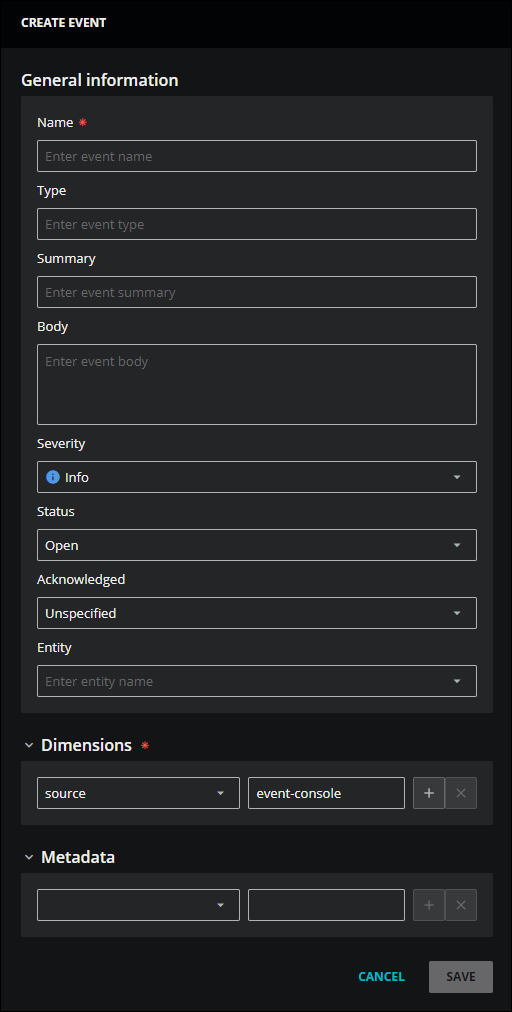
Field Description Name A name for this event. When combined with Dimensions, this name makes your event unique. This is a required field. Type Uniquely identifies the type of event. You might enter a type using the same "name" that you use for systems that have an event ID, such as "linkDown" or "fault-F0157". Summary A short description of the event. This is a recommended field. Body A long description of the event. Severity The event severity level. The default value is Info. Status Defines the current state of an event. You can select Default (unknown), Open (event is actively ongoing), Suppressed (event should be suppressed), or Closed (event is known to have subsided). The default value is Open. Acknowledged Indicates if the event is acknowledged. You can keep the default value of Unspecified, or select True or False. Entity Enter the name of the entity associated with this event. -
In the Dimensions section, enter the dimensions associated with this event. Dimensions, when combined with Name, make this event unique. This is a recommended field.
Use the criteria builder to enter field names and values for the event. The field names must be unique for the event. Both the field name and the value must be strings. Typically, you might enter the same dimensions used for the entity to which the event is related.
-
(Optional) In the Metadata section, enter the fields associated with this event. The field names must be unique for the event.
Note
You can associate the event with a source in either the Dimensions or the Metadata fields. If these fields are not specified, then the source is set as a metadata field to the value of "default".
-
Click SAVE. A success message appears confirming that your event is created. Optionally, click CANCEL to discard your changes.
If your event isn't created, check that you have entered information in the Name field.