Creating dashboards
To set up a new dashboard for your workflow, you first create a new dashboard, define its scope of entities, and then add and configure tiles. During dashboard setup, you can customize the dashboard to fit your use case. For example, you may want to narrowly define the dashboard scope for your needs, so you can use a query to define your scope or appy filters.
Use the following set of tasks to create or edit dashboards.
Tip
For assistance creating a new dashboard, check out the dashboard tutorials.
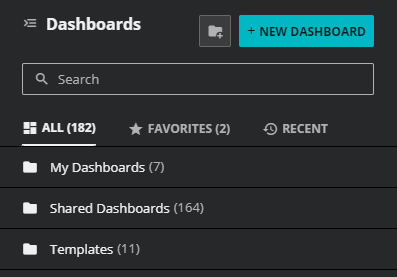
Create a new dashboard
This task assumes you are in DASHBOARDS.
-
Click the DASHBOARDS tab.
-
Click the dashboards menu button.
-
Click NEW DASHBOARD.
-
(Optional) In the name field, replace My Dashboard with a descriptive name for the dashboard.
To finish your dashboard, proceed to the next task.
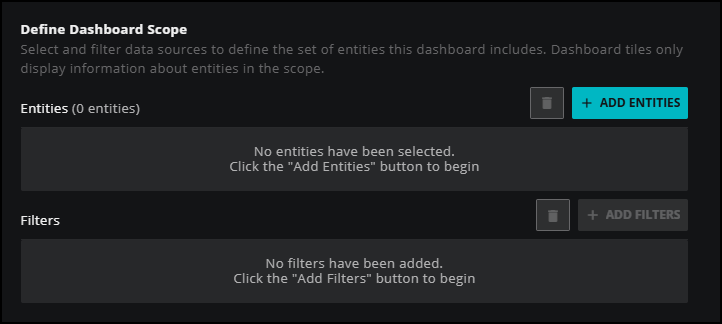
Specify dashboard scope
This task assumes you are creating a new dashboard or editing an existing dashboard.
-
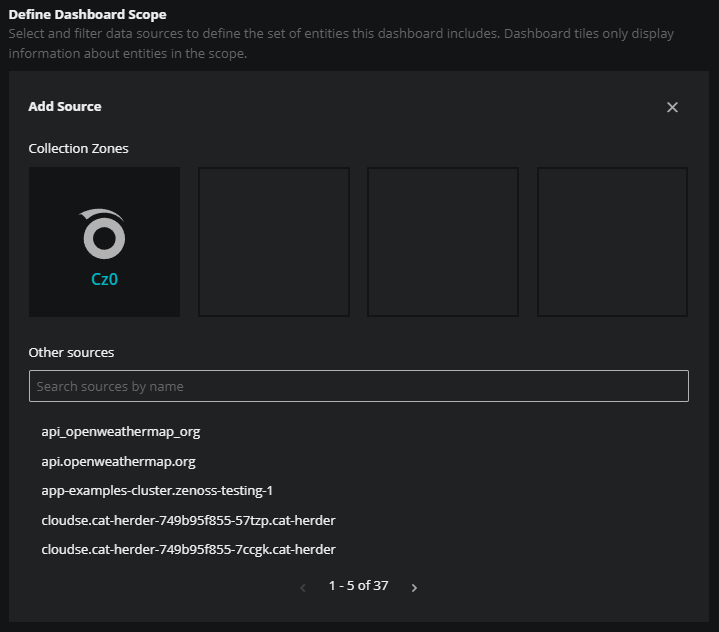
To specify a scope for the dashboard, in the Define Dashboard Scope panel, click ADD ENTITIES. The Add Source box opens.
Note
When no scope is specified, tiles can be sized and placed, but not fully configured.
-
You can combine entities from Collection Zones and from streaming data sources in a scope.
-
To add entities from a Collection Zone, see Specifying Collection Zone entities.
-
To add entities from a streaming data source, you can do one or both of the following:
-
Enter the name of the source in the Other sources field, and then click the match. Confirm it as a source entry before saving the dashboard.
-
Define a query in the Other entities by query field. See Use a query to define entities.
-
-
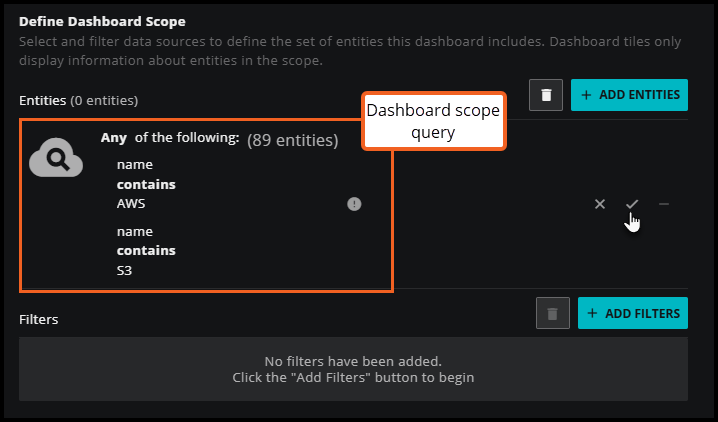
Use a query to define entities
This is an optional task. This task assumes you are creating a new dashboard or editing an existing dashboard.
-
In the Define Dashboard Scope panel, click in the Other entities by query field.
-
Define your query. As you enter text, the query bar suggests options for each part of the query, including property names, operators, values, and connectors. If needed, use the autocomplete dropdowns to change a part of the query.
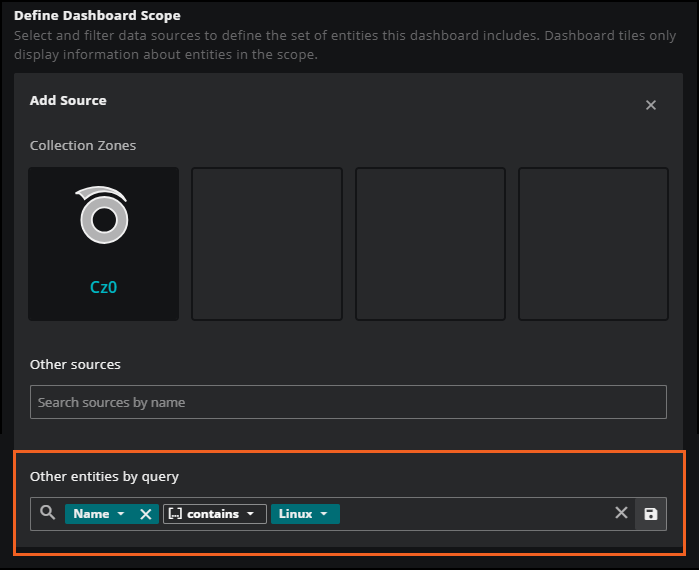
For more information about selecting properties and operators when using this query builder, see Search your inventory. You can apply the same types of queries that you build for finding entities in Inventory to defining entities to include in your dashboard scope.
-
Click Save (file icon) in the query bar to keep your query, or X to cancel. After you save your query, confirm it as a source entry before saving the dashboard.
Note
When you define the scope of entities by entering a source name and adding other entities through a query, the system treats the query like an "OR" clause. Entities are included from both the specified source(s) and the defined query.
Optionally, you can apply filters to this scope. The query and the filters work as an "OR" clause, so any entity that satisfies either the query or the filter is included in the dashboard.
Apply filters to the scope
This is an optional task. This task assumes you are creating a new dashboard or editing an existing dashboard.
-
In the Define Dashboard Scope panel, click ADD FILTERS to apply filters to the selected scope.
-
To define the clauses, click in the first field to select an entity field. This field offers suggestions based on the user-friendly names in the Dictionary or from live data in your system. The suggestions are in alphabetical order for quicker browsing.
-
Select your operator, then select your value. Start typing in the value field for autosuggestions based on your selected entity field.
-
To add another simple clause or add a compound clause, use the buttons in the top of your query. To remove a clause, click the X button next to the clause.
-
When finished, click SAVE FILTERS to apply your filter to the scope or click the trashcan icon to delete the filter.
Note
You can apply filters to work with a query entered in the Other entities by query field. The query and the filters work as an "OR" clause, so any entity that satisfies either the query or the filter is included in the dashboard.
-
When finished defining your scope, click SAVE in the upper-right corner to return to Dashboards.
Adding tiles to your dashboard
After you create your dashboard and define its scope, you are ready to return to Dashboards to add tiles. This task assumes you are in DASHBOARDS.
-
Click the add tile control or ADD A TILE.
-
In the AVAILABLE TILES palette, click a tile to add it to the dashboard.
When you add a tile, the AVAILABLE TILES palette becomes the TILE CONFIGURATION dialog box. For more information about configuring individual tiles, see the following pages:
- Anomalies tile
- Entity Count tile
- Event List + Count tile
- Graph tile
- Map tile
- Metric + Number tile
- Metric Outliers tile
- Notes tile
- Site Availability Monitor (SAM) tile
- Service Health tile
- Stoplight tile
- Top Event Producers tile
Note
For optimal performance, Virtana recommends limiting dashboards to 4-6 tiles per page and 2 pages per dashboard.
-
Click SAVE.
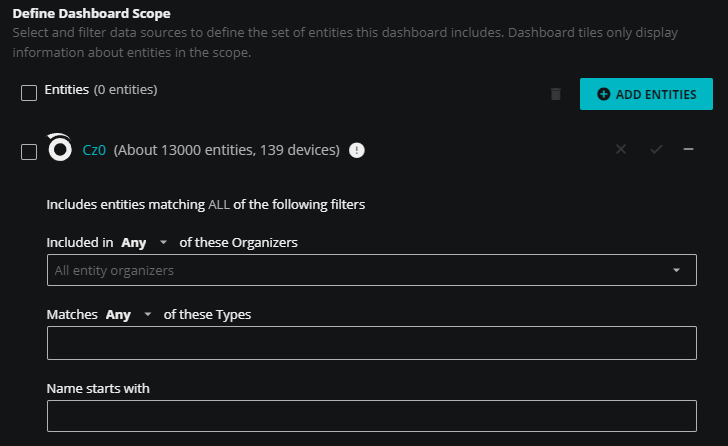
Specifying Collection Zone entities
You can filter the entities to include in a scope by organizer, entity type, and name.
-
In the Define Dashboard Scope area, click ADD ENTITIES.
-
In the list of Collection Zones, click the name of a Collection Zone.
Most organizations have just one, Cz0.
-
(Optional) To filter by organizer, click in the Organizers field, and then navigate into the organizer hierarchy.
You can select multiple organizers and join them with ANY (logical AND) or ALL (logical OR).

-
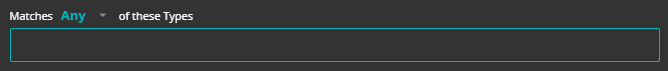
(Optional) To filter by entity type, enter an entity type name in the Types field.
You can select multiple types and join them with ANY (logical AND) or ALL (logical OR).
Tip
As a best practice, use entity types in scopes for Collection Zones. Take the time to review the available entity types and to understand how they are used in Collection Zones. For more information, see the list of entity types.
-
(Optional) To filter by entity name, enter the name or the first part of the entity name in the Name field.

-
-
Click the check mark icon immediately below the ADD ENTITIES button.
-
Optionally, add filters to your dashboard scope. See Create a new dashboard for step-by-step instructions.