Collection Zone dashboards
Deprecation notice
The CZ Dashboards feature is deprecated and will be removed on December 15th, 2025.
While you can continue to use CZ dashboards, after the feature is removed, any existing dashboards may no longer work as expected. Therefore, as a best practice, we suggest that you migrate your dashboards to Virtana Service Observability Dashboards. The features in Virtana Service Observability Dashboards replace dashboard functionality in CZ.
Note
Your Collection Zone might not include the DASHBOARDS tab. Use the Virtana Service Observability Dashboards instead.
Creating a new dashboard
A default administration dashboard is created when you launch Collection Zone. Administrators can customize this dashboard. However, the default dashboard cannot be deleted.
Users that are not administrators initially see a read-only version of the default administration dashboard. Non-administrators can create dashboards that display distinctive information or are targeted to a specific type of user or to only themselves. To customize a dashboard, select who can view it, and select and customize portlets to display the most important information. The number of customized dashboards is not limited.
To create a dashboard:
-
From the Add icon on the dashboard controls, select New Dashboard.

-
Use the following table to complete the fields in the dialog box.
Field Description Dashboard Name A name for the dashboard. In the dashboard list, the name the user who creates a dashboard is displayed next to the dashboard name. Who can view this Dashboard? The name of the user account or user group that can view the dashboard. To specify a user group, you must be logged in as a member of the group to add. Number of Columns The number of columns to display in the dashboard. The default is 3. Clone from dashboard Create a dashboard with no portlets (the default) or copy the portlets of the current dashboard. -
Click Create.
Adding a portlet to a dashboard
You can customize a dashboard by adding portlets. A dashboard can display multiple instance of the same portlet type. For example, several Device Chart portlets showing different device classes.
To add a portlet to a dashboard:
- Select the dashboard to which you wish to add a portlet.
-
From the Add icon on the dashboard controls, and select Add portlet.

-
In the Portlet field, select a portlet.
The dialog box adds fields for configuring the selected portlet.
-
Edit the fields as appropriate for the selected portlet.
- Click Add.
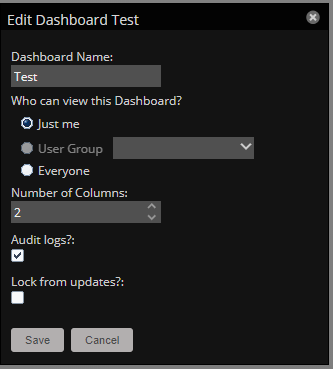
Editing dashboard settings
Customize a dashboard to display a different number of columns or limit access to the dashboard.
-
On the upper-right side of the dashboard, click the Action icon.
-
Use the following table to update the fields in the dialog box.
Field Description Dashboard Name A name for the dashboard. In the dashboard list, the name the user who creates a dashboard is displayed next to the dashboard name. Who can view this Dashboard? The name of the user account or user group that can view the dashboard. To specify a user group, you must be logged in as a member of the group to add. Number of Columns The number of columns to display in the dashboard. Audit logs? Update the audit log when changes are made to the dashboard. Lock from updates? Prevent unauthorized edits of the dashboard. -
Click Save.
Moving portlets in a dashboard
To arrange portlets, click the portlet header and drag the portlet to any location on the dashboard. The other portlets move to accommodate the moved portlet's position.
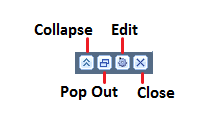
Using portlets
Use the following buttons to control how a portlet is displayed.
| Button | Description |
|---|---|
| Collapse | Shrink the portlet so that only the title appears on the dashboard. |
| Pop Out | Expand the portlet to occupy the entire browser window. |
| Edit | Edit portlet settings. |
| Close | Remove the portlet from the current dashboard. |
In tabular portlets, you can control the display by sorting columns as well as adding and hiding columns.
- To sort based on a column, hover over the column header and click the arrow to display the sort and display options.
- To add or hide columns, hover over the Columns entry and check or clear the boxes of the columns to add or hide.
List of available portlets
Daemon Processes Down
Contains system self-monitoring information.
Device Chart
Allows the display of a graph of multiple data points for a selected device class.
Device Issues
Displays a list of devices associated with color-coded events of critical, error, or warning severity levels. To view details, click a device name. To go to the event console for the device, click an event.
Event View
Displays a list of events similar to the view on the Event console. Event management buttons are not provided in the Event View portlet.
Google Maps
Shows configured device locations and network connections.
HTML Portlet
Displays HTML content. You must use HTML markup in this portlet. If you want to populate a portlet with content from a specific URL, use the Site Window portlet instead.
Multi-Graph Report
Displays an existing Multi-Graph Report (created by using the Reports page). You can choose a specific graph group from the multi-graph report and select the time range for the portlet.
Network Map
Displays a network map for a defined network that is being monitored. You can define the refresh interval and level of depth of the map.
Open Events Chart
Displays a bar graph of the number of open events, grouped by severity. You can define the event class to be display and the number of days for which to show events.
Organizers
Choose the root organizer (devices, locations, systems, groups) and then child organizer options are enabled.
Past Events Line Chart
Displays a line chart of past events grouped by severity. You can define the event class to be used and the number of past days for which to show events.
Production States
Shows devices assigned to a particular production state. If needed, you can define multiple production states to display.
Site Window
Initially provides links to resources such as product guides, forums, and training events.
You can customize the portlet to display any web page. However, Virtana recommends that you keep a portlet with the default URL so that you can stay up-to-date with Virtana training and product updates.
Watch List
Allows the display of high-level status of device classes, groups, systems, event classes, and locations that you select.
Adding the Impact Services portlet
You can customize the Collection Zone dashboard by adding an Impact Services portlet.
- In Collection Zone, choose DASHBOARD.
- In the top-right of the main dashboard area, click Add, and then choose Add portlet.
- From the Portlet drop-down list, choose Impact Services.
- In the Preview pane, choose the organizer or services that you want to show in the portlet, and then click Add.
Note
If you delete the organizer displayed in a portlet, the portlet is deleted as well.