Site Availability Monitor (SAM) tile
You can use site availability monitoring to proactively prevent and limit adverse situations by checking the uptime of your services and notifying business and application owners and administrators of problems before they impact your organization.
Uptime is the percentage of time that a website is online and accessible to users over a given time period, such as hourly, daily, or monthly. Continuous monitoring of web application uptime and responsiveness is called site availability monitoring.
Virtana Site Availability Monitor (SAM) allows you to monitor web applications using the HTTP or HTTPS protocols. Using this feature, you can accomplish the following tasks:
-
Monitor your cloud-based web applications with no installation.
-
Monitor your web applications in the same view as the broader infrastructure.
-
Gain availability and performance insights into your web applications.
-
Specify frequency of monitoring for your production and non-production requirements.
-
View the performance of a single or multi-site web application, including performance and availability, on a dashboard.
-
Receive events and take actions using other Virtana Service Observability features, including intelligent dashboards, Smart View, Actions, Inventory, and Events. Events are automatically created.
-
Share dashboards and performance reports with other users.
Set up the Site Availability Monitor (SAM)
To get started with a SAM, connect your site and then create your dashboard.
If you want to monitor both external and internal sites and endpoints, then you might want to configure the SAM collector. The SAM collector monitors the availability of internal sites, such as servers, network devices, and applications, from within your firewall. For more information, see Site Availability Monitor (SAM) collector.
Setup notes
Note the following before setting up SAM for your organization.
-
SAM is used to monitor public-facing internet sites.
-
SAM uses a client redirect policy that has a maximum of ten consecutive redirect requests.
-
After setup, you can collect SAM metric data.
Site Availability Monitor (SAM) tile
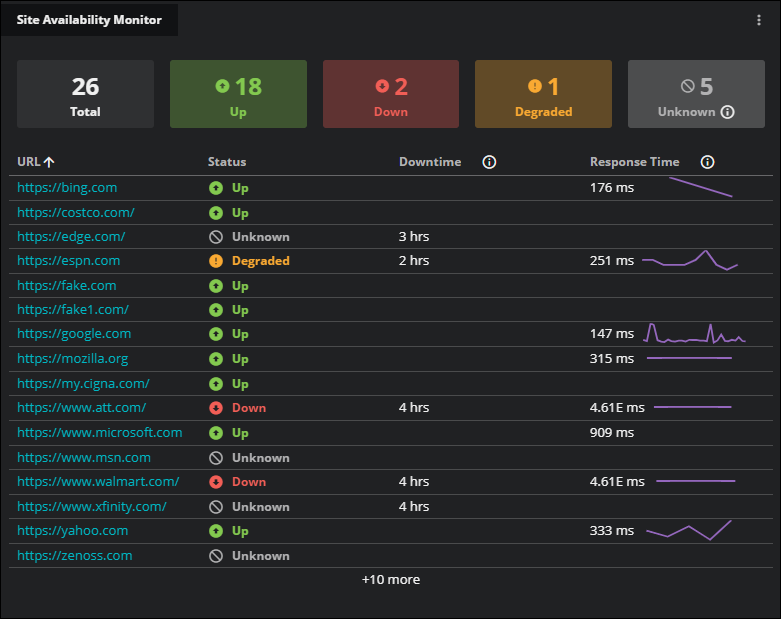
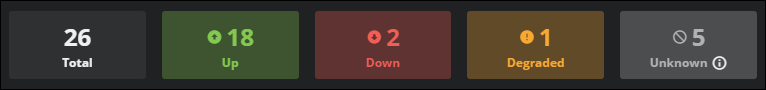
You can opt to view the tile as a visualization, a table, or both. The visualization provides a quick snapshot of the uptime status of your sites. The total number of monitored sites appears at the top of the tile followed by the subtotals of any sites with impacted availability.
Status indicators
The SAM uses event severity to determine the availability of your connected sites. The availability states include Up, Degraded, Down, and Unknown. If there are no events with a severity of Critical, Error, or Warning for the site, then the availability state is Up.
View the following list for more information about these status indicators:
- Up
- No negative events for this site. Status appears as green.
- Degraded
- One or more subpages of the URL contain events that have a severity of Critical or Error. Status appears as yellow.
- Down
- All of the subpages of the URL contain events that have a severity of Critical or Error. Status appears as red.
- Unknown
- Indicates an invalid site or unmonitored site. When a site is added, but monitoring is turned off, then the status shows as unknown and the indicator appears as gray. For more information, see Set site availability monitoring for a specific site. If you only want to see enabled sites in the SAM tile, then edit the tile and set the Show unknown sites option to the off position.
Table view
The Table view provides details to assist you in your investigation. The table is limited to 50 rows, which are listed alphabetically by site URL.
You can view the following columns of information at a quick glance:
- URL
-
The URL of the monitored site. Click the URL to view the entity in SmartView. However, if a URL has a status of Unknown, you can't view the entity in SmartView.
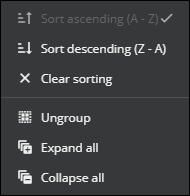
The URL column also contains sorting options, including Group by URL. This option is useful if you want to investigate the specific subpages that are down.
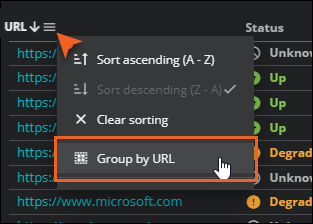
When you click Group by URL, the Subpage column appears in the table. Expand the URL row to view the information for the subpages. Click a subpage to view the entity in SmartView.
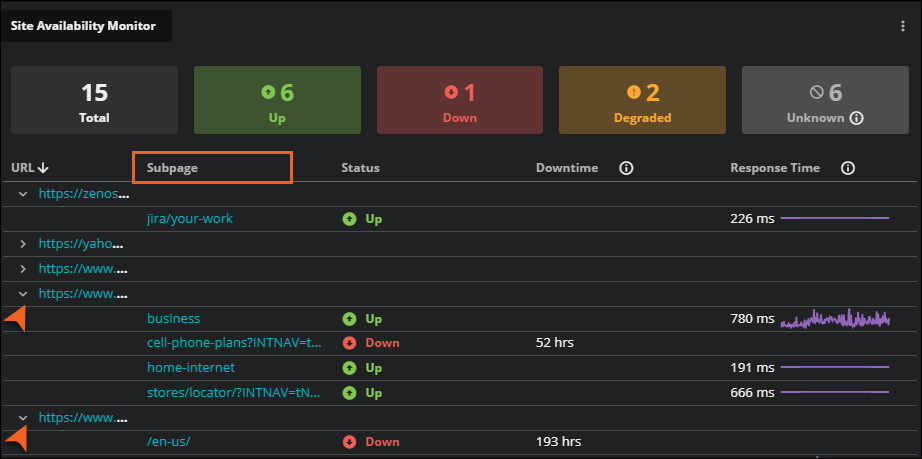
You can also choose to expand all the rows or collapse all the rows in this menu. If you have a lot of sites to view, you can sort the rows in ascending or descending alphabetical order.
- Status
- The availability level for the monitored site. Levels include Up, Degraded, Down, and Unknown. The total number of events for each availability level is listed in the visualization. See Status Indicators for more information.
- Downtime
- Total amount of time that the URL has been down from the start of the event until now. Downtime appears as seconds, minutes, or hours.
- Response Time
-
The average latency (in milliseconds) of the URL based on the selected time range for the dashboard. Very large numbers are expressed in scientific (exponential) notation.
Note
Response time isn't shown if a site has a status of Unknown.
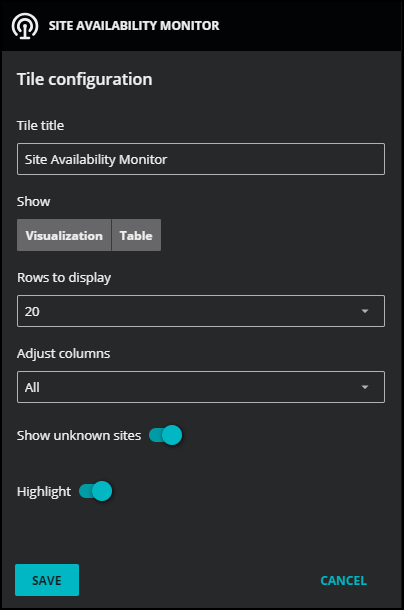
Configuring the tile
You can customize the SAM tile for your needs.
-
In the upper-right corner of the tile, click Edit (pencil icon) to open the configuration dialog box.
-
Edit the following options:
Field Description Tile title Set the title of the SAM tile in your dashboard. Show Select Visualization, Table, or both. Rows to display Total number of rows to show in the tile. You can choose 5, 10, 20, or 50. Adjust columns Select the columns to display in the table. URL always shows, but you can choose to show or hide the Status, Downtime, and Response Time columns. Show unknown sites To include unknown sites in the tile, click the toggle to the on position. Status shows as Unknown when monitoring is turned off. For more information, see Set site availability monitoring for a specific site. Highlight To highlight the site totals in the visualization, click the toggle to the on position. When off, the totals appear without highlighting. Show disabled sites To include sites that are inactive, click the toggle to the on position. Show URL short names To show the URL short names for your sites and subpages, click the toggle to the on position. When off, the URL path appears. For more information, see About URL names in SAM tiles. -
(Optional) Create a specific filter just for the tile. This is useful if you need to compare different services side-by-side. For example, maybe you want to compare the performance of your services in different regions.
Use the query builder to create and apply a filter to the tile:
-
Click the + (plus sign) to add a clause.
-
To define the clauses, click in the first field to select an entity field. This field offers suggestions based on the user-friendly names in the Dictionary or from live data in your system.
-
Select your operator, then select your value. Start typing in the value field for autosuggestions based on your selected entity field.
-
To add another simple clause or add a compound clause, use the buttons in the top of your query. To remove all the clauses, click the X button in the top of the query.
-
-
To keep your changes, click Save.