Map tile
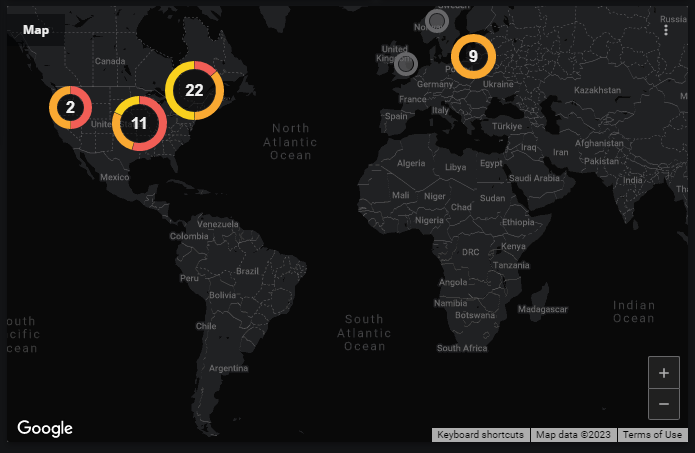
The Map tile displays the Location organizers in a dashboard's scope on an interactive map provided by Google Maps.
- If an organizer contains no entities, or if the entities it contains have no open events during the current time range, the tile displays a green circle centered on the address associated with the organizer.
- If an organizer contains entities, and if the entities have open events during the current time range, then the tile displays a doughnut chart representing the events.
At minimum zoom, Location organizers in the same area are clustered together. At maximum zoom, each Location organizer is displayed as a separate green circle or doughnut chart. You can zoom with your mouse wheel or the zoom control in the lower-right corner of the map.
When you click on a doughnut chart, the tile either zooms in and displays more green circles or charts—one for each location clustered in the clicked chart—or displays a table of the entities associated with the organizer. In a table, entities are sorted first by event severity and then alphabetically. When you click on an entity name, Virtana Service Observability opens the entity's Smart View page.
Optionally, you can filter the scope of a tile by specifying the Location organizers to include, and you can filter the events displayed in a tile by specifying one or more event field comparisons.
The Map tile displays the count of open, deduplicated events that have a severity of Critical, Error, or Warning.
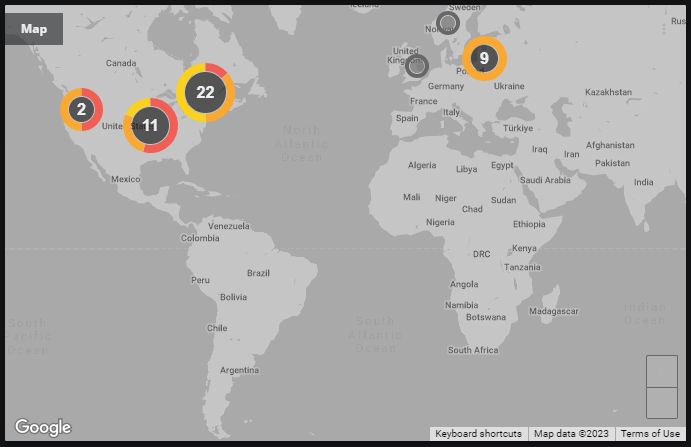
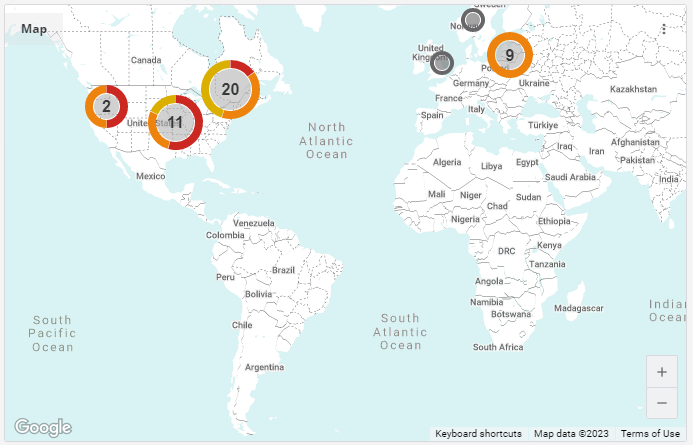
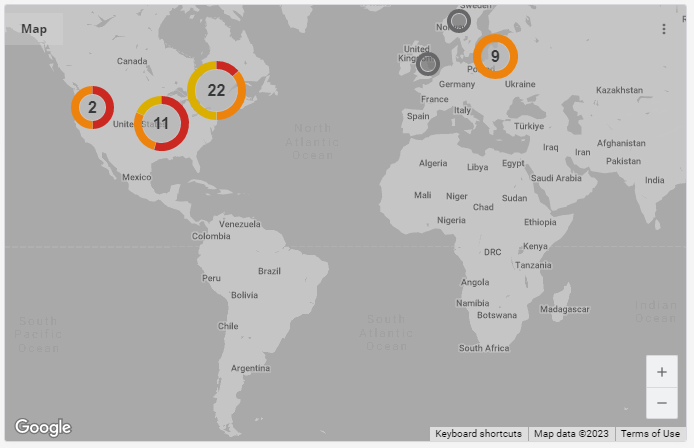
Example tiles
Dark mode and light mode are Virtana Service Observability interface settings. Grayscale is a Map tile setting.
Tile configuration options
- Tile title
- The text that appears in the upper-left corner of a tile.
- Map Locations
- (Optional) The names of one or more specific Location organizers to include in a tile.
- Events Filters
-
One or more comparisons that select events to include in a tile. Events that do not match all comparisons are excluded.
You can specify the CZ Production State field in comparisons.
- Grayscale Map
- A toggle that changes the contrast of a map.
- Tile scope filters
-
(Optional) Create a specific filter just for the tile. This is useful if you need to compare different services side-by-side. For example, maybe you want to compare the performance of your services in different regions.
Use the query builder to create and apply a filter to the tile:
-
Click the + (plus sign) to add a clause.
-
To define the clauses, click in the first field to select an entity field. This field offers suggestions based on the user-friendly names in the Dictionary or from live data in your system.
-
Select your operator, then select your value. Start typing in the value field for autosuggestions based on your selected entity field.
-
To add another simple clause or add a compound clause, use the buttons in the top of your query. To remove all the clauses, click the X button in the top of the query.
-