Events console
In the Events console, you can view events associated with all entities in the current time range and access the tools for managing events. When you initially open the Events console, you can quickly scan your most critical events on a single page. This view is useful when you have a substantial number of events, but need to focus on the most important ones first.
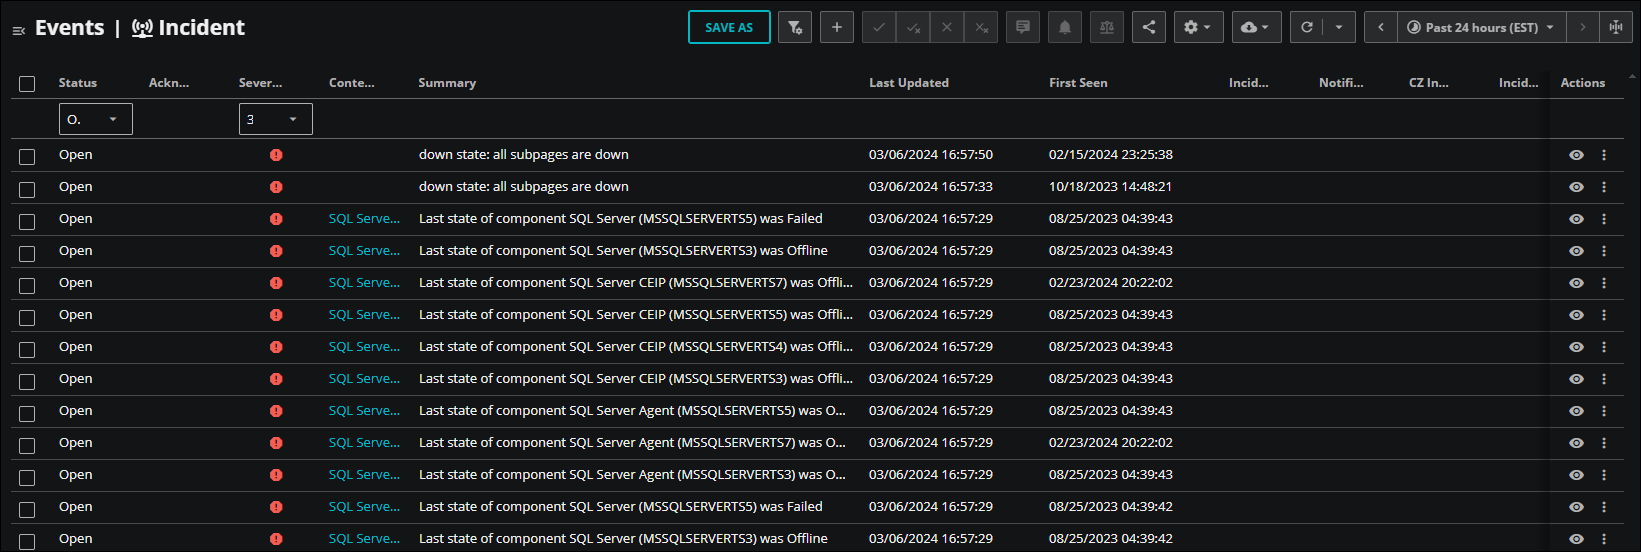
In this view, you can acknowledge, close, and view more details about an active event. You can also compare multiple events, annotate selected events, and share the list of events with team members. By default, the most critical events appear at the top of the list.
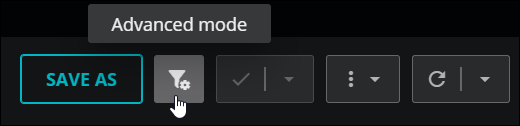
When you are ready for a more enriched view of all your events, switch to Advanced mode.
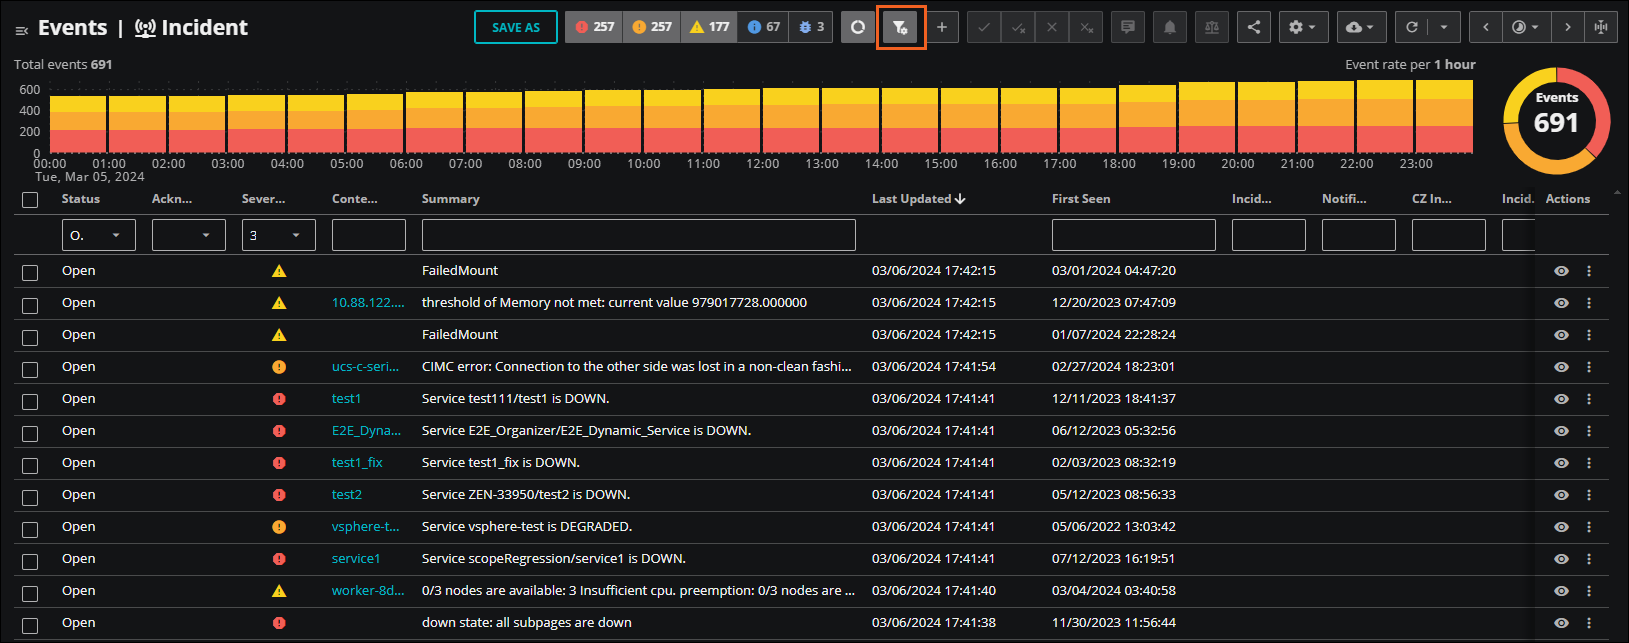
In advanced mode, you have access to more filtering, sorting, and visualization options. View the column and donut charts to capture at a glance the status and severity of your events. The column chart shows the occurrence of the events over a selected time range while the donut chart shows the total number of events in the time range.
If you choose to hide the column and donut charts, you can view a simple heat map of events. You also can filter events by a variety of columns that appear in the view. In addition, you have access to the full toolbar, including severity level indicators.
Note
If the tools are dimmed, check with your administrator about your permissions or check to see if all your events are originating with Collection Zones. While you can still view all events in the event console, you can only use the event management controls for those events that originate with streaming data sources. To manage events that originate from Collection Zones, go to the source Collection Zone's event console.
Opening the Events console
You can examine events from the following locations:
- The Virtana Service Observability header is visible on all tabs. In the header, click EVENTS. To view your full list of events with visualizations and severity labels, click the Advanced button in the toolbar.
Note
Your account must be assigned the Read Only User role or a more privileged role to see the EVENTS tab. To perform some actions in the console, your account must be assigned the user or manager role.
Tour of the Events console
When you initially open the Events console, you can quickly view your most critical events on a single page. Using the full toolbar, you can quickly perform basic tasks for these events, such as acknowledging and closing events, comparing events, and adding notes to events. You can even create an event rule without leaving the console. In addition, you can export the list of events, share your view with team members, and adjust the view settings, such as adding or removing columns to create the view you want.
When you want a more robust view of your active events, switch to the Advanced mode. Here, you can view several key visualizations of events, severity counts, and an interactive table of events. The Advanced mode button is located in the toolbar.
In the following tour of the console, note that some features and activities are only available in Advanced mode.
Charts
Advanced mode only
View the column chart and donut chart to quickly assess the status of events. The column chart shows you the occurrence of the events over a selected time range while the donut chart shows the total number of events in the time range.
Each column in the column chart represents a slice of the selected time range. The events appear in the columns as defined by their First Seen and Last Seen criteria. Therefore, each event might appear in more than one column in the chart. The donut chart only counts each event once for the whole time range.
If you select to hide the column and donut charts, you can view a simple heat map of events.

Similar to the column chart, the heat map is also divided into slices of the time range. Each slice contains the events as defined by their First Seen and Last Seen criteria.
Toolbar
The toolbar provides a variety of actions, including managing events, creating events, setting the refresh interval, and more.
Initial view:

Advanced mode:

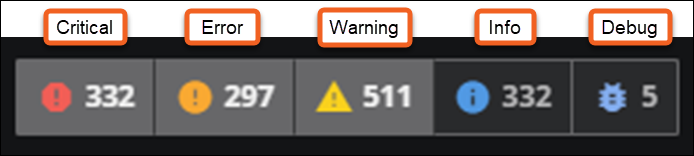
View events by severity
Advanced mode only
The event severity buttons determine which events are included in the console and display the current deduplicated count of events at each severity level.
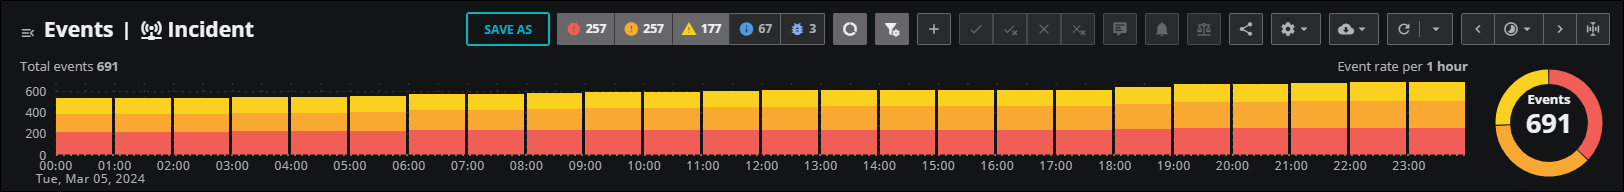
Show charts
Advanced mode only
Use the Event chart button to toggle between charts and a heat map.
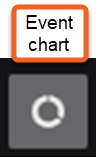
When you click Event chart, you can view the following visualizations:
-
The column chart shows events grouped by the severity. To create the chart, Virtana Service Observability divides the current time range into 24 equal periods and then represents the total number of events during each period with separate columns (or no column).
-
The donut chart provides a proportional view of event severities during the current time range.
Click the button again to view a heat map that represents the distribution of events during the current time range.
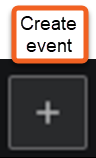
Create events
If you want to manually create an event, click the Create event (plus sign) to open the Create events dialog box.
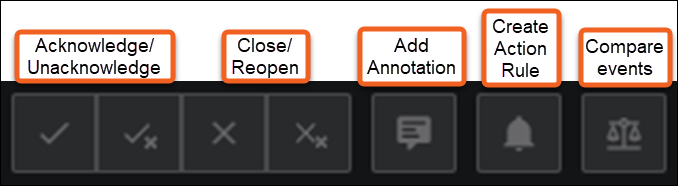
Manage events
Use the event management actions to modify and manage events. To activate a button, select an event or multiple events in the table.
| Action | Description |
|---|---|
| Acknowledge | Click to indicate that some type of action has occurred to address the issue the event represents. |
| Unacknowledge | Click to remove an acknowledgement and indicate that some type of action hasn't occurred to address the issue the event represents. |
| Close | Click to close an event, indicating that it isn't current or isn't in need of some type of action to remedy. |
| Reopen | Click to reopen a closed event to indicate that an event is current and needs some type of action to remedy. |
| Add annotation | Click to open the Add Event Annotation dialog box where you can enter a plain text message to associate with the selected event. |
| Create action rule | Select an event(s) then select Create Action Rule to open the Add Rule dialog box that populates an events trigger in an action service rule. |
| Compare events | Select two to four events and then click Compare events. The table is replaced with a side-by-side view of the details of selected events. |
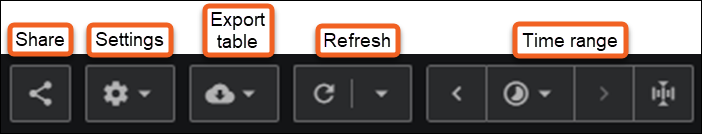
General actions
These actions cover a general range of tasks to customize your events view, such as adjusting columns, setting refresh options, changing the time interval, and exporting table data.
| Action | Description |
|---|---|
| Share | Make the event console view public if you are the owner, or copy its URL to your clipboard, which you can then pass along. |
| Settings | From Settings, you can clear filters, adjust columns, and restore defaults. When you click Adjust columns, the ADJUST COLUMNS dialog box opens. Here, you can select or hide columns in the events table, or change the order of the columns in the table. Limiting the columns to just what you need can help avoid confusion. |
| Export table | Download the results of the current query in HTML, CSV, Excel, or JSON format. |
| Refresh now | Refresh the console. |
| Refresh options | Set a refresh interval. When you click Refresh options, the Events Auto Refresh box opens. You can activate the auto refresh option and enter a refresh interval. Options include 1, 3, 5, and 10 minutes. |
| Time range actions | Use the time range settings to change the time range, the time zone, and to create custom time ranges for the quick-select panel. When you change the time range, Virtana Service Observability updates all the data on the page. You can fine-tune this range by filtering the First seen and Last seen columns. To learn more, see Interactive table. |
Interactive table
The table presents events in rows and columns, and the columns can be reordered, resized, or removed. For a closer look at individual events, each event row includes a link to an event details panel, which displays all available event details, as well as graphs of related metrics and information about related events.
Also, like entity names in dashboard tiles, entity names in an events console are Smart View links. When you open an entity's Smart View page, the Smart View time range matches the events console time range.
Some of the columns provide additional features to assist in your investigations.
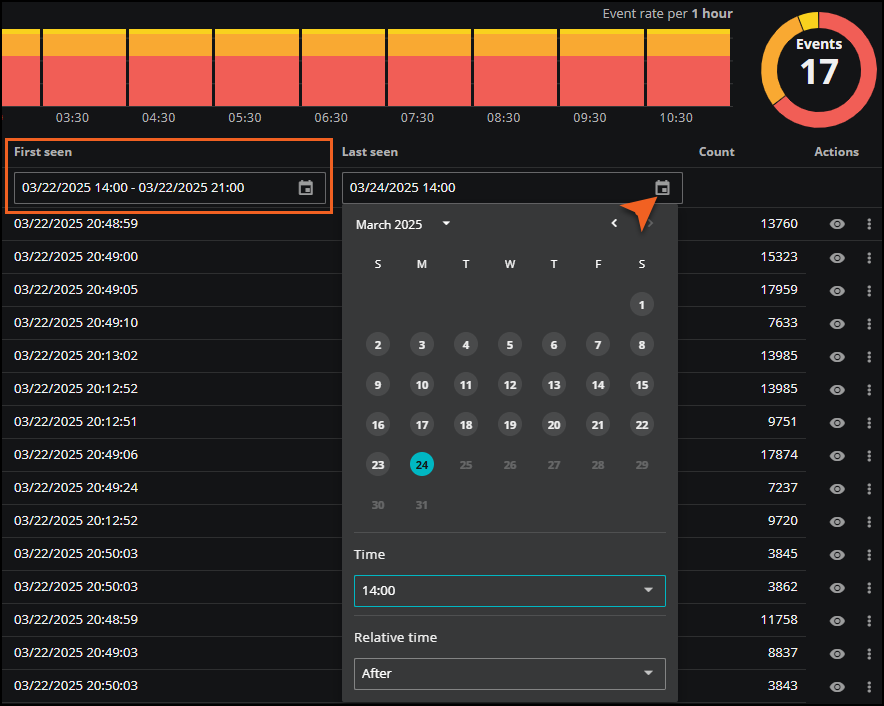
Filtering First seen and Last seen columns
You can filter the First seen and Last seen columns by date and time. Click the calendar option in the column header and select Between to apply a date range to search for events within your specified range. Alternatively, select Before or After, then select a single date and corresponding time to search for events before or after the date. Click Close (X) in the header to clear the filter. The filters work independently for each column, but you can use both together to create a custom range.
Tip
When you add a filter, expand the width of the column to view the full contents of the header, or scroll through the header.
This feature is useful when you want to fine-tune the existing time range for the console. For example, you can include only events first seen in the last 24 hours instead of all open events in the default time range.
To apply a filter, perform the following steps:
-
Click the calendar icon in the First seen or Last seen column to open the date and time panel.
-
Select a date in the calendar.
-
Select a time.
-
In the Relative Time field, select one of the following options:
-
Before: Includes events first or last seen before this date and time.
-
After: Includes events first or last seen after this date and time.
-
Between: Includes events between the selected dates and times. When you select this option, be sure to select two dates in the calendar and enter corresponding From and To times to create a range within the column. This is the default option.
-
Event Views panel
Use the options in the Event Views panel to share, edit, copy, and delete your event view.
To open the Event Views panel, click the Events menu button in the upper-left corner of the page.
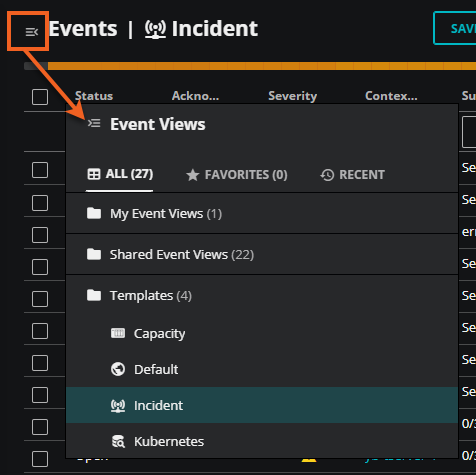
To display a different event view, click the name of one of your event views in the My Event Views folder, or open the Shared Event Views folder and click the name of a shared event view. Also, you can click the FAVORITES or RECENT tabs to find views that you marked as favorites previously or displayed recently.
Note
The FAVORITES tab isn’t available to read-only users because read-only users can’t mark event views as favorites.
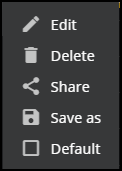
When you hover your pointer over an event view, you can click the Actions (⋮) menu to select different options, such as editing, deleting, or sharing the event view, or setting it as your default user preference.
Events Overview
For a deep dive into events and how they are used throughout the system, see Events overview.