2025 updates
Welcome to the 2025 update notes for Virtana Service Observability (formerly Zenoss Cloud). The visible and not-so-visible parts of Virtana Service Observability are updated regularly. This page highlights the new features and enhancements.
December
This month's updates include the following enhancements:
Homepage > Collection Zones
If you are a manager, you can now edit the labels of your Collection Zones (CZ). This is especially useful if you have multiple Collection Zones.
On the homepage, click the edit icon for your collection zone to change the label. Note that you are only updating the label. The ID, the name, and the URL of the Collection Zone remain the same.
You can view this label throughout the system, including in Dashboards when you are viewing the dashboard scope or when you are defining the dashboard scope. You can also view it in Adminstration when you are adding or editing restriction filters.
Site Availability Monitor (SAM) connector
You can now bypass the certificate validation in your configuration for a URL using the new insecure YAML option. This setting is useful when you are monitoring a site that uses a nonstandard certificate, such as a “self-signed certificate”, which you might use in testing environments.
- To skip certificate validation for a URL and its subpages, set the
insecureflag totrue. - If you don't want to skip certificate validation for a URL, set the
insecureflag tofalse.
This is an optional setting. The default value is false.
In the following example, the insecure option is set to skip certificate validation for example-02 and its subpages:
urls:
  example-02:
    interval: 2m
    address: https://example02.org
    disabled: false
    insecure: true
    subpages:
      anything-red:
        path: anything/red/
        method: get
To learn more, see URL configuration options.
Smart View
You can now pin tooltips for entity and metric details in Smart View. Previously, these tooltips disappeared when you moved your mouse away, making it difficult to compare data or copy values.
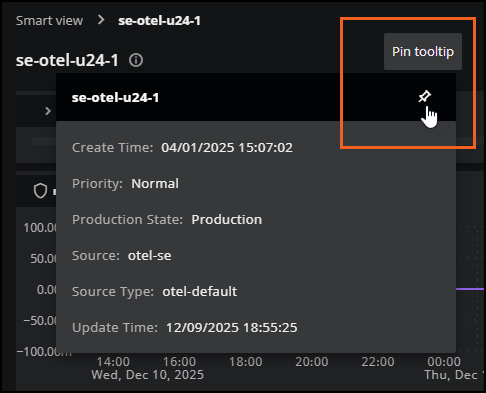
Tooltips remain visible until you unpin them, so you can compare data in tooltips side-by-side and copy any needed values. You can also pin multiple entity tooltips at the same time.
To learn more, see Smart View.
Inventory and Smart View
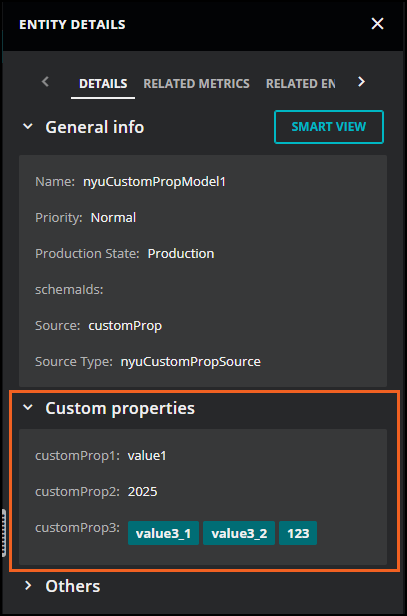
You can now view custom properties for entities in both Inventory and Smart View. This is useful if you use custom properties for entities that originate from streaming sources. For example, you can use the Zenoss API to populate custom property values for your entities, then copy these properties from the device to incoming events.
When you run a query in Inventory, click the Details (eye) icon to open the Details panel. If custom properties exist for this entity, the Custom properties section appears. Open this section to view the properties associated with the entity.
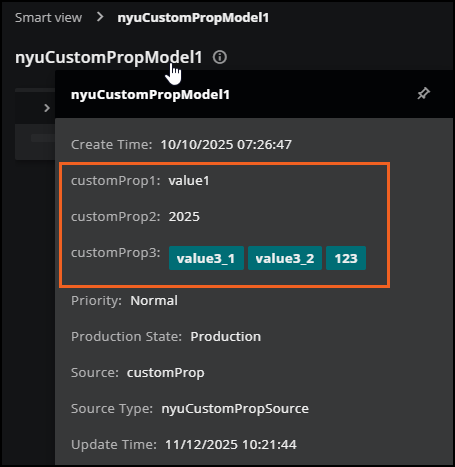
In Smart View, hover your mouse over the entity to open the entity details panel. If custom properties are associated with the entity, they are listed here.
To learn more, see Inventory and Smart View, and the Zenoss API for custom properties.
November
This month's updates include the following enhancements:
Administration > API Clients > User API key
You can now use the User API key to let clients perform most general user operations. This key type is specifically required to interact with the Model management service, which manages various aspects of entities including:
- Entity management
- Custom properties
- Production state and priority
- Reading entity activity and type (schema ID)
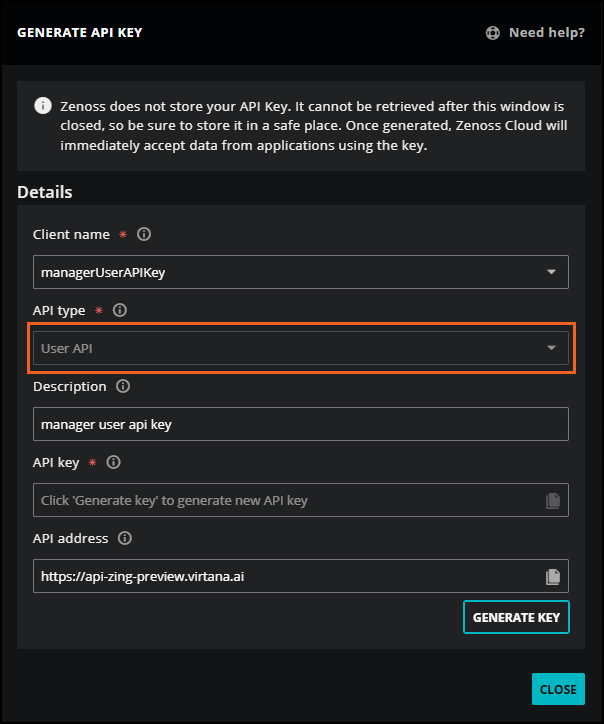
When generating an API key on the ADMIN > API Clients page, select User API in the API type field.
To learn more, see Authentication keys for Zenoss API clients.
Zenoss API > Model management service
The Zenoss API now supports the model management service, which includes the Custom Properties API.
To learn more, see Model managment service and Custom properties resources.
Site Availability Monitor (SAM) connector
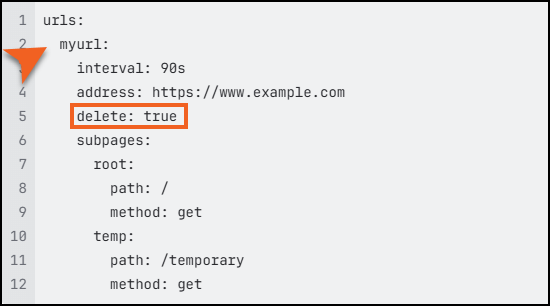
You can now modify or remove a configuration for a URL and/or subpage using the new delete YAML option. This feature removes associated entities on both the URL and subpage levels stored in your SAM configuration file. Using the delete option is a best practice for keeping your system clean and clear of redundant site names.
- To delete a URL and its subpages, insert
deleteat the URL level. - To delete specific subpages, insert
deleteat the subpage level for the desired subpage or subpages.
In the following example, the delete option will remove myurl and its subpages:
To learn more, see Delete SAM connector configuration options.
October
This month's updates include the following enhancements:
Site Availability Monitor (SAM) connector
You can now modify or remove a configuration for a URL and/or subpage using the new delete YAML option. This feature removes associated entities on both the URL and subpage levels stored in your SAM configuration file. Using the delete option is a best practice for keeping your system clean and clear of redundant site names.
- To delete a URL and its subpages, insert
deleteat the URL level. - To delete specific subpages, insert
deleteat the subpage level for the desired subpage or subpages.
In the following example, the delete option will remove myurl and its subpages:
To learn more, see Delete SAM connector configuration options.
Administration > Maintenance Windows
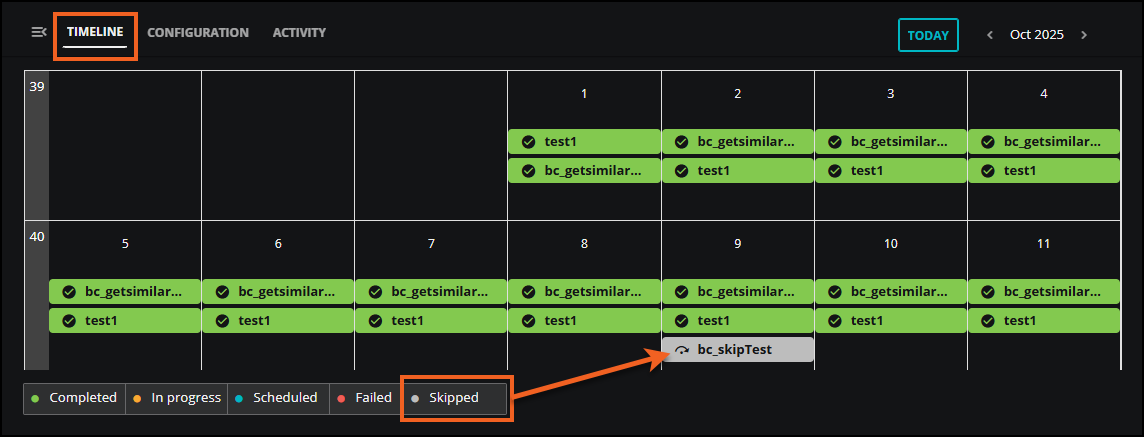
Skipped status
You can create a maintenance window even when no entities currently match the criteria. This is useful when you want to create the maintenance window now for entities that you are adding to the system later. If the maintenance window runs before the entities are added, the maintenance window is marked with the status of Skipped. You can view this status in the Timeline and Activity tabs.
To learn more, see Create a maintenance window.
Maintenance window override
Maintenance Window scheduling now gives you more flexibility and control when you need multiple similar windows to include the same entities. This is useful in complex environments where such multiple similar windows are necessary for different scopes or operational purposes.
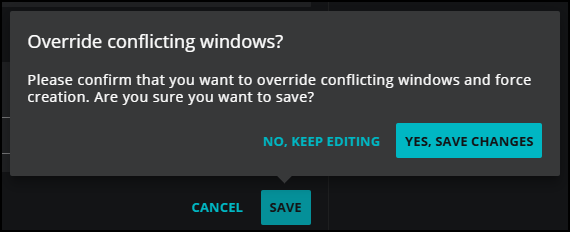
You can now include the same entities in multiple maintenance windows concurrently, including scheduled and on-demand windows. When scheduling maintenance windows with overlapping timeframes and matching criteria, the similar maintenance windows appear in the Scheduled maintenance windows panel with a warning messsage.
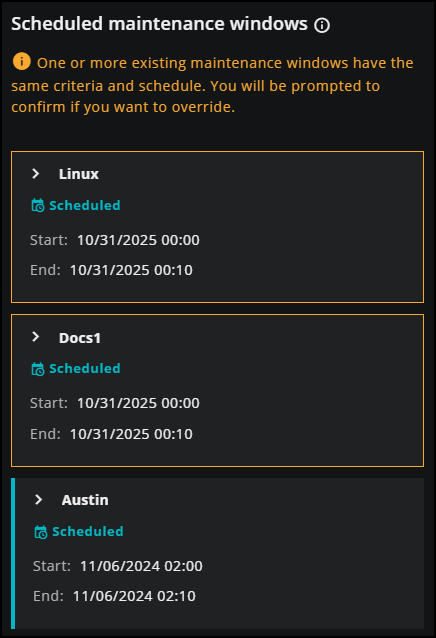
You will then be asked to confirm if you wish to override and save the new window, allowing the entities to exist in multiple similar maintenance windows simultaneously. This aligns with the Zenoss API's force flag functionality.
To learn more, see Scheduling maintenance windows.
September
This month's updates include the following enhancements:
Dashboards
There are several enhancements in Dashboards this month:
Pinning a time range
You can pin a default time range to a specific dashboard so it always opens with the same time range. Click Save time range (pin icon) to save the configured time range for the selected dashboard. Click it again to discard the saved time range.
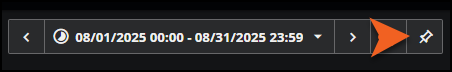
You can pin a time range for a specific set of dates, such as August 1-31, or you can choose a relative time range. If you pin a relative time range such as "Last 7 Days", the pinned time range will always be relative to the current time. So, if you open it next week, it will show the last 7 days from that point.
This is useful if your team uses dashboards that serve as reports for specific periods. For example, you can set up a "Monthly Storage Utilization" dashboard that automatically shows the last 30 days of data every time it's opened, making it easier for everyone to see consistent, report-style views.
To learn more, see Time range in Dashboards.
Shared dashboards
You can now organize your shared dashboards in folders within the Shared Dashboards panel. Previously, shared items appeared as a flat list. Now, shared individual dashboards remain at the top level, while shared folders maintain their hierarchical structure, mirroring the My Dashboards panel.
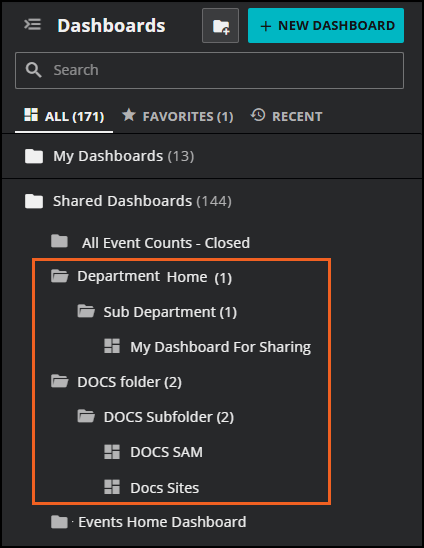
This enhancement is useful if you have many shared dashboards because it provides a familiar and organized structure, simplifying the process of locating specific dashboards.
To learn more, see Panel folders in Dashboards.
Graph tile
When configuring a Graph tile in your dashboard, you can set the new Thresholds option for each metric in your graph. When you click this toggle to the on position, any metric threshold that applies to the chosen metric appears in the graph as a dashed red line.
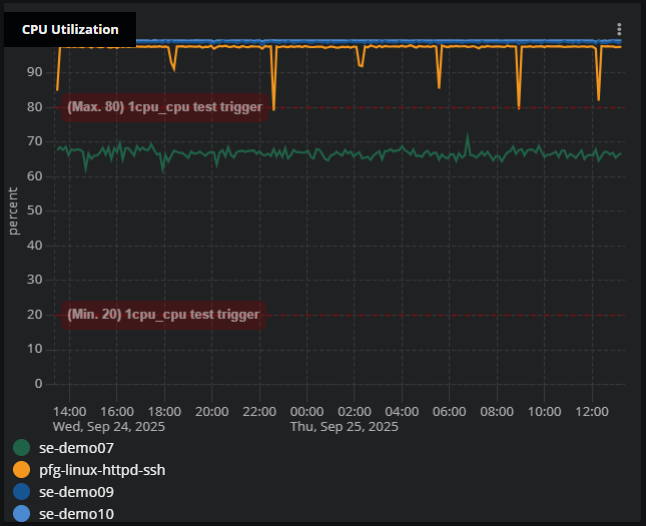
This feature is useful when you create metric triggers that define high or low thresholds that you want to see in your dashboard. By plotting the threshold value on the graph tiles, you can understand the expected limits of the metric and when an action, such as sending a notification, is triggered.
When a metric threshold appears on a graph tile, you can select the new Triggers menu option for the tile. The METRIC DICTIONARY opens so you can view the trigger configurations for any metrics on the graph.
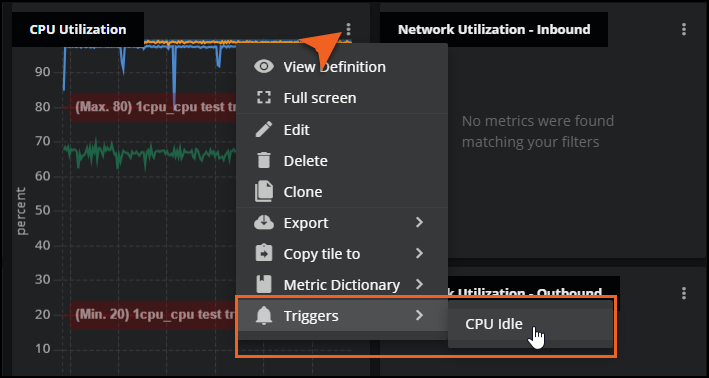
To learn more, see Graph tile.
Performance improved for large dashboards
Now, only visible dashboard tiles will load, improving performance. As you scroll, tiles load and unload quickly. Dashboards with many tiles will see faster loading, reduced browser resource usage, and improved responsiveness. Single-screen dashboards are unaffected.
Inventory
When exporting data in Inventory, you now have the option to email the exported file to yourself. This feature is useful for large datasets, ensuring reliable delivery and allowing you to perform other tasks while the whole table is processed.
To open, click Export table, select Email a copy, then select a format. Your export will download locally to your browser and a copy is sent to your logged-in email address.
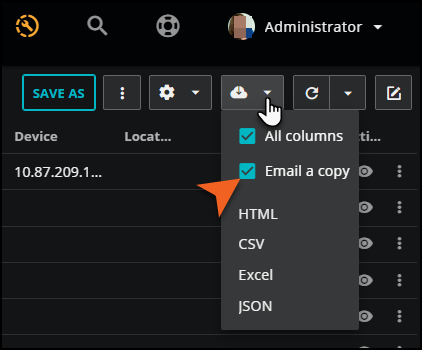
In your inbox, look for the email sent from noreply@zenoss.io with the subject line Export: Inventory. Open it and click the provided link to view your exported inventory table.
Supported export formats include:
- HTML
- CSV
- Excel
- JSON
To learn more, see Export query results.
Administration > Maintenance Windows
You can now schedule maintenance windows to start at any minute of the hour, rather than only in 10-minute increments. This change provides you with more precise control when scheduling windows. Also, it aligns with current Collection Zone and API capabilities that already support minute-level scheduling.
Existing maintenance windows are unaffected by this change.
To learn more about setting start times and durations for maintenance windows, see Scheduling maintenance windows.
August
This month's updates include the following enhancements:
Administration > Dictionary
To gain useful insights from accumulated counter metrics like system.cpu.time, you can mark these metrics as rate metrics in the Dictionary, ensuring they are consistently displayed as rates throughout the system.
Some metrics like OpenTelemetry's system.cpu.time are counters, not point-in-time measurements. They represent accumulated values, such as CPU time since startup, and are best viewed as rates. Converting these raw, ever-increasing values to a rate (value/time-since-last-value) provides useful information. For example, system.cpu.time as a rate ranges from 0 to 1, showing CPU time spent in a state as a percentage.
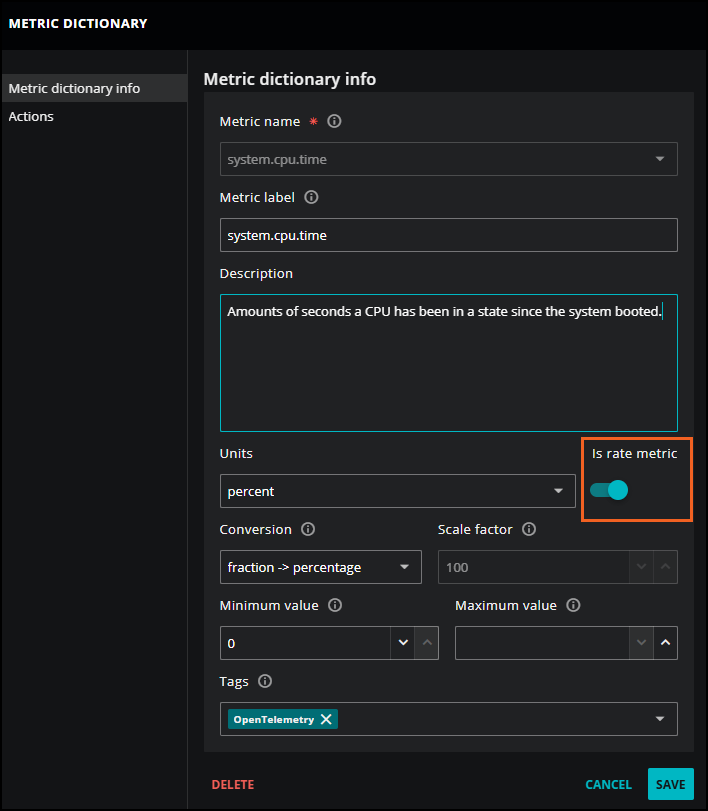
In the Dictionary, as an administrator, you can mark these values as rate metrics by clicking the Is rate metric toggle to the on position so they are always displayed as rates in Smart View and throughout your system. By default, Is rate metric is set to off for all new and existing metric dictionary entries because most metrics are not rates.
To learn more, see Dictionary and Dictionary Service API.
Actions > Event triggers
When defining your event trigger criteria, you can turn on Match multiple events. This setting can help you prevent a notification storm — an overwhelming number of notifications — when many events occur within a short period of time that matches your trigger's criteria.
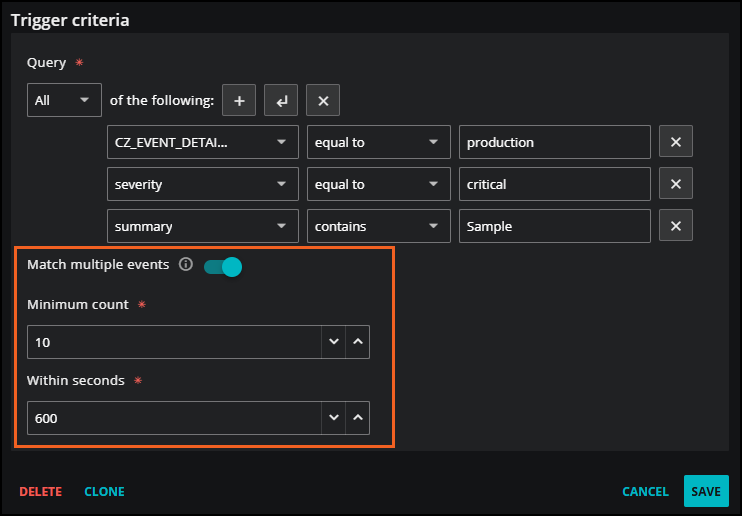
When creating or updating your event trigger, click the Match multiple events toggle to the on position, then specify your criteria. You won’t receive any notifications until at least the "minimum count" of open events matches the criteria within the specified number of seconds.
When this minimum count threshold is met, you will receive a single notification for that trigger, regardless of how many additional events match the criteria. The notification clears only when enough of the triggering events have cleared to bring the number below your configured minimum count.
To learn more, see Add an event trigger.
July
This month's updates include the following enhancements:
Dashboards > Metric Outliers and Top Event Producers tiles
Now, you can use the improved Label format field in the Metric Outliers and Top Events Producers tiles of Dashboards to help your users better identify and analyze telemetry data.
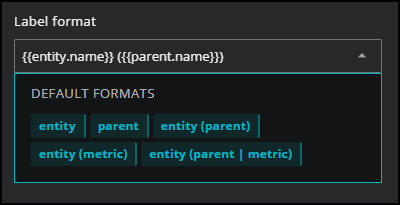
In these two tiles, you can create labels to include in hover text and in the legend using the mustache template system. If needed, you can enter your own label format in the field by using any combination of metric (if available), entity, and parent entity fields. These can either be entered into the box or selected from the provided list. As you enter text, the list is filtered to only fields that match what you entered.
For example, you might want to monitor a ping_loss_ratio metric across numerous targets, but they're aggregated under a single entity in the Metric Outliers tile. When you hover your mouse over individual cells, they all show the same entity name, making it difficult to pinpoint which specific target is experiencing packet loss.
The improved label format field allows you to customize the hover labels for each cell to display granular metric dimensions, such as ip and server fields. By setting the label format to {{metric.ip}} ({{metric.server}}), you can see the relevant target details, providing clearer insights into the root cause of the packet loss.
Note
This feature was previously introduced in the Graph tile. In the Metric Outliers tile and the Graph tile, you can use the metric, entity, and parent fields. In the Top Event Producers tile, you can only use the entity and parent fields.
To learn more about label formats in tiles, see Metric Outliers tile, Top Event Producers tile, and Graph tile.
Dashboards > Site Availability Monitor (SAM) tile
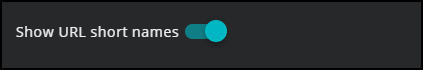
You can now opt to show a short URL name instead of the long URL path in the Site Availability Monitor (SAM) tile.
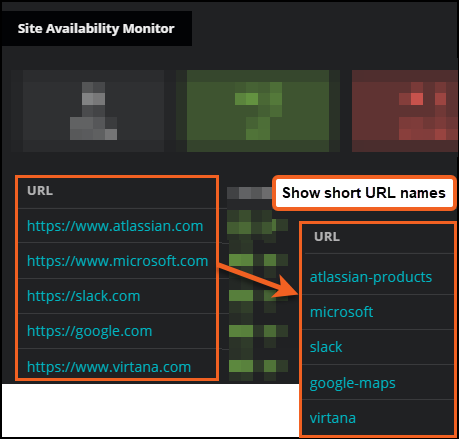
In Tile configuration for the SAM tile, turning on the Show URL short names option will display the short URL name. These short URL names are configured within your SAM configuration file.
To learn more, see About URL names in SAM tiles.
Collection Zone > Dashboards
Effective December 15, 2025, all dashboard features and the DASHBOARD tab within Collection Zone will be retired.
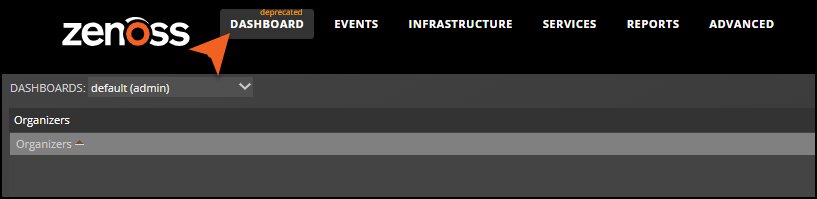
It’s recommended that you create new dashboards and migrate existing dashboards to the Zenoss Cloud > Dashboards feature before this date.
To learn more, see Deprecation notices.
June
This month's updates include the following enhancements:
Use queries to define dashboard scopes
The new Other entities by query field allows you to define your dashboard scope by querying all available entities. This powerful tool is useful for various types of dashboards, such as those you might use for OpenTelemetry workflows.
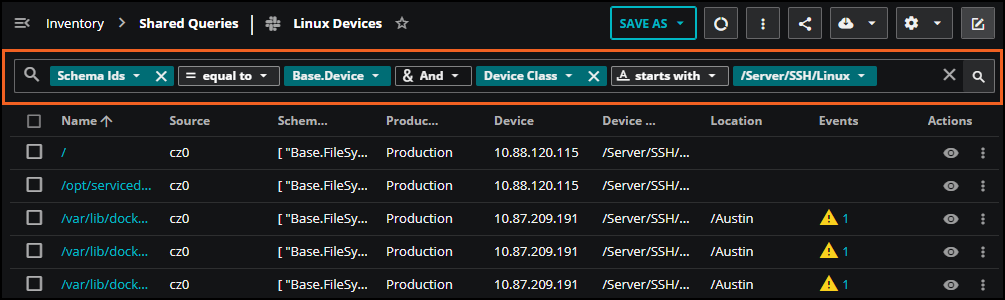
Similar to the query builder in Inventory, the Other entities by query field provides flexibility when you construct queries to define dashboard scopes. As you enter text, the query bar suggests options for each part of the query, including property names and operators, so you can focus on just those entities you want to see in your dashboard.
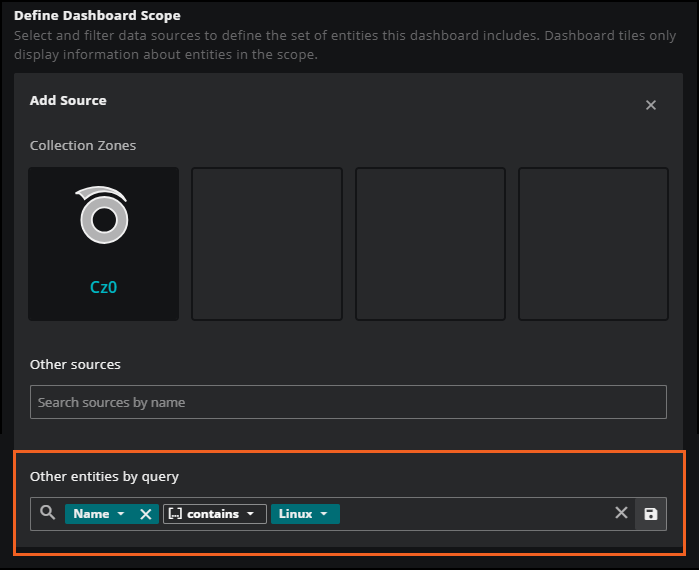
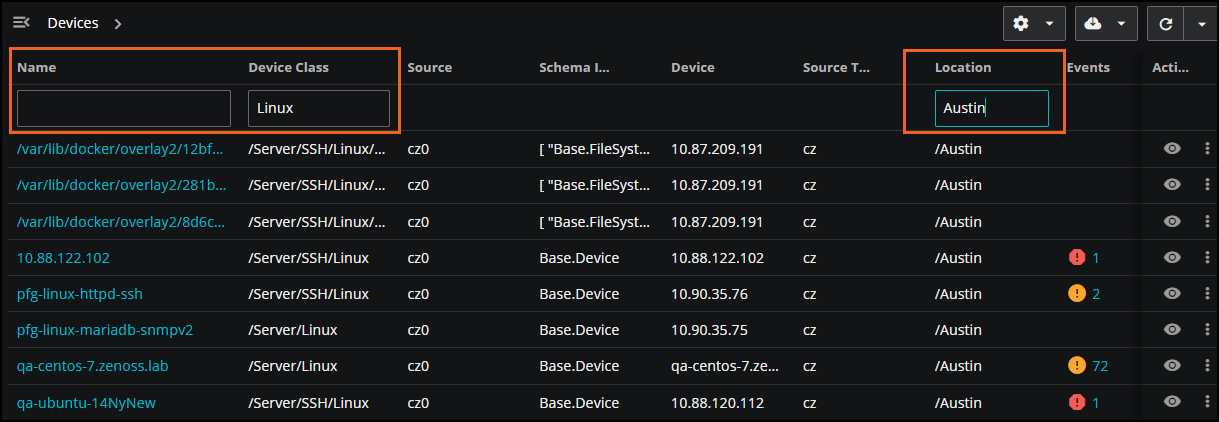
When combined with other scopes and filters, this dashboard query acts as an "OR" clause, so entities are included if they satisfy either the defined query or the selected scope. For example, you could define a dashboard scope by querying for all entities that have a name containing "Linux" and combine it with a filter for all entities in a specific city, like "Austin". Any entity that satisfies either the query or the filter is included in the dashboard.
To learn more, see Use a query to define entities in a dashboard scope.
Inventory > Organizers
If you created organizers for your devices in Collection Zone (CZ), you can view them in Inventory. The new ORGANIZERS tab in Inventory provides a Cloud-based alternative to the Infrastructure page in Collection Zone (CZ), to help you transition your workflows more seamlessly to Zenoss Cloud.
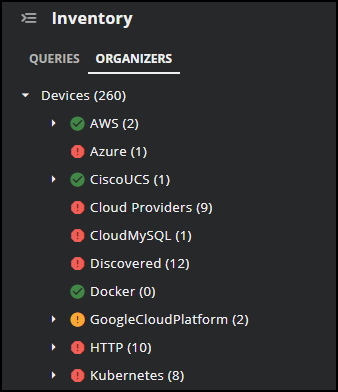
Selecting a specific organizer or device updates the inventory table and the query to reflect your selection. You can also filter properties in the table columns to narrow down your results.
To learn more, see the Organizers tab in Inventory.
Site Availability Monitor (SAM) connector
Configuring your SAM connector is improved.
-
We added the
ping_timeoutoption to the URL configuration so you can customize the amount of time that the data source waits for a response from the URL before timing out. This setting overrides the global setting of 10 seconds. -
The
send_metricsoption is now an optional setting with a default value oftrue.
To learn more, see SAM connector configuration options.
Dashboards > Sharing
You can now share dashboards and dashboard folders with specific users or user groups. This is useful if you want to restrict access to a folder of dashboards to just a specific group of users within your organization.
You can share an open dashboard in the main view, or you can go to the Dashboards panel and select to share a dashboard or folder of dashboards. In the SHARE WITH tab, click in the field to select user groups or users who you want to grant access to. You can select multiple users and groups.
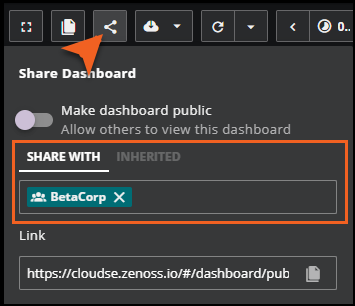
Click the INHERITED tab to see if the dashboard has an inherited share access. For example, if the dashboard resides in a folder that is shared with specific users, then the INHERITED tab displays the other groups or users that have access to the dashboard through the folder.
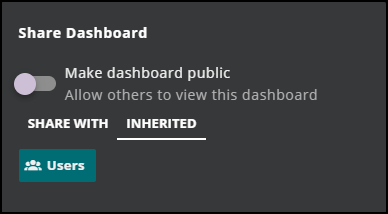
You must have the Manager role to share dashboards with specific users.
To learn more, see Sharing dashboards.
Actions > Destinations
You can now add multiple email addresses for an email destination. This is useful when you want to send notifications to multiple recipients.
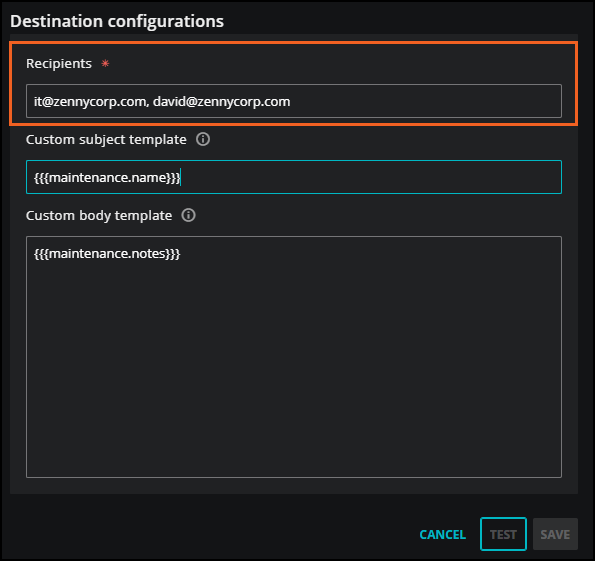
When adding or updating an email destination, you can add more than one email or template in the Recipients field. Separate each destination with a comma.
To learn more, see Destination fields.
May
This month's updates include the following enhancements:
Administration > Maintenance Windows
There are a couple of enhancements for maintenance windows:
Failed status
In the rare case where your maintenance window doesn't start or finish as expected, you can investigate why on the Activity tab of Maintenance Windows.
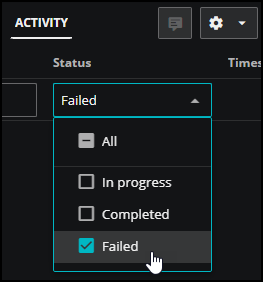
Occasionally, a maintenance window can fail to run because no entities are linked to it or errors occur during the run. The Activity tab now shows the updated Failed status and specific details about any errors encountered, helping you understand what went wrong.
To learn more, see Maintenance windows.
Override exit production state
You can now specify a production state for your entities after the maintenance window ends. For example, you might want to set the entities to a specific state in your workflow, such as Pre-Production or Production. By default, after a maintenance window ends, the system automatically returns your entities to their previous production state.
You can set the new Override exit production state options in the Actions section of maintenance window configuration, available in both Inventory and Maintenance Windows. By default, the option is off.
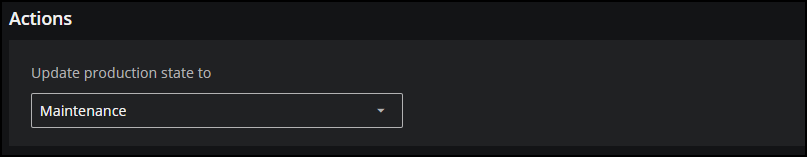
To learn more, see Maintenance windows.
Inventory > Search
We’ve enhanced the Inventory search tool with a new, faster, and more responsive query builder. This updated search replaces both the previous Quick Search and Advanced Search features, offering the speed of a quick search alongside comprehensive filtering capabilities.
To learn more, see Inventory.
April
This month's updates include the following enhancements:
Dashboards > Service health tile
You can sort the service health tile table by any column in either ascending or descending order. You configure these sorting preferences when creating or editing a service health tile, and they are saved as part of the tile's configuration.
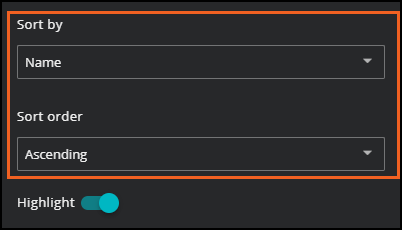
You can also temporarily sort the table by clicking the column headers on the tile, but these changes are not saved. Additionally, the table now includes pagination, allowing you to select the number of rows displayed per page and navigate between pages.
To learn more, see Service health tile.
Actions > Stale data triggers
The new Notification condition option allows you to choose how many notifications you want to receive when the conditions for a trigger are met because data has become stale.
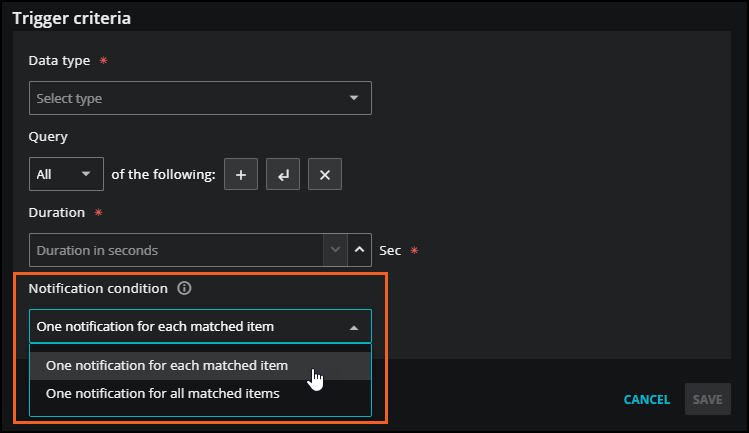
This is useful when you have many entities that frequently send metrics like "CPU-Utilization." If your trigger matches only the metric name and Zenoss stops receiving the metric from multiple entities, you can choose to receive a single notification for all impacted entities or a separate notification for each entity.
To learn more, see Adding stale data triggers.
Administration > System preferences
You can now view restricted IP addressses in System Preferences.
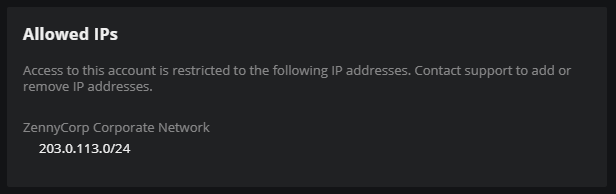
Restricting access of your Zenoss Cloud instance to specific IP addresses enhances security by helping to prevent unauthorized use. To enable this feature, contact Zenoss support to specify the allowed IP addresses or ranges. All other IP addresses will be blocked by default.
Inventory > Summary view
Inventory summary view now features new and improved tiles to help you gain quick insights into your selected query results.
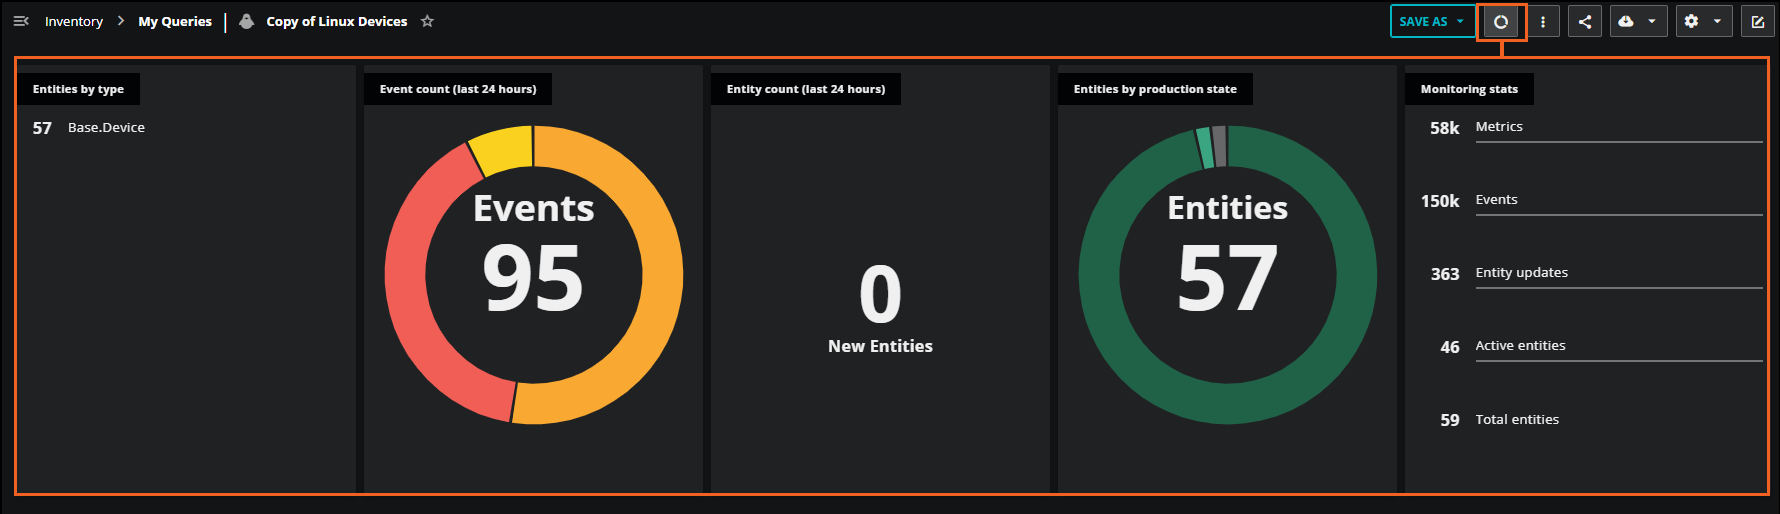
-
Entities by production state: The Entities donut chart lists the total number of entities in the query with a breakdown by assigned production state. Hover your mouse over the donut chart to see the number of entities in each state.
-
Monitoring stats: This tile provides an overview of entity monitoring statistics for immediate insight into monitoring activity. The list captures high-level metrics based on your current query.
To learn more, see Inventory.
Smart View > Component view
The new Component view provides an interactive list of device components and their respective components in a table format. This perspective offers a valuable overview of a device and its components for your investigation.
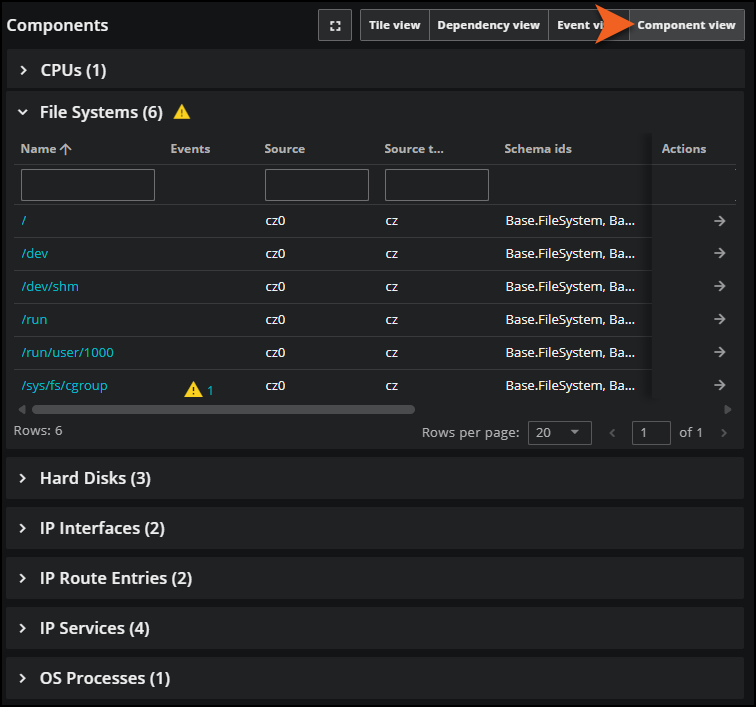
You can view the device components in each group, inspect all the events for the group in this view, and navigate to Inventory for further details.
To learn more, see Smart view.
Dashboards
The Stoplight and Metric Outliers tiles now feature the Set target percent option so you can decide if you want to apply a target percentage of time or not when a metric exceeds the specified thresholds.
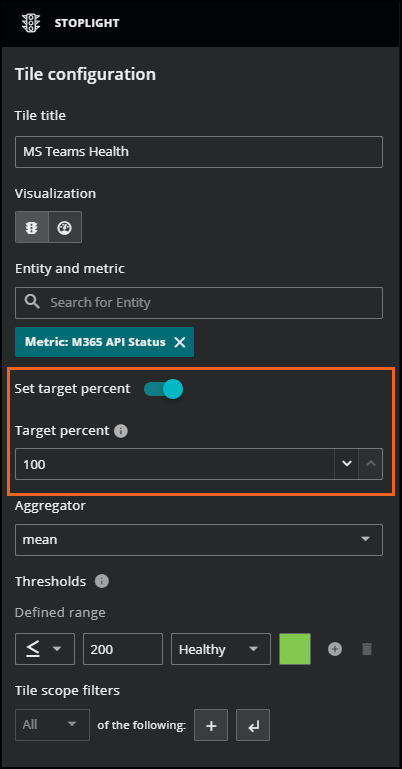
Previously, the Target percent was a required option. You can use it to specify the percentage of the dashboard's current time range during which the data points of a metric have to meet the specified threshold(s).
By default, the Set target percent option is turned off.
-
When turned off, you can’t set Target percent and only the most recent metric value is considered for thresholds.
-
When turned on, you must enter a Target percent value that determines if the most recent value exceeds the threshold for the specified percentage of the time range.
Note that the Set target percent is automatically enabled for existing dashboards so that they continue to work as expected.
To learn more, see Stoplight and Metric Outliers.
Smart View
Secondary metric cards now feature more graph details so you can better understand the information and its scale. Previously, the cards featured a sparkline graph. Now the graph includes a y-axis label and units.
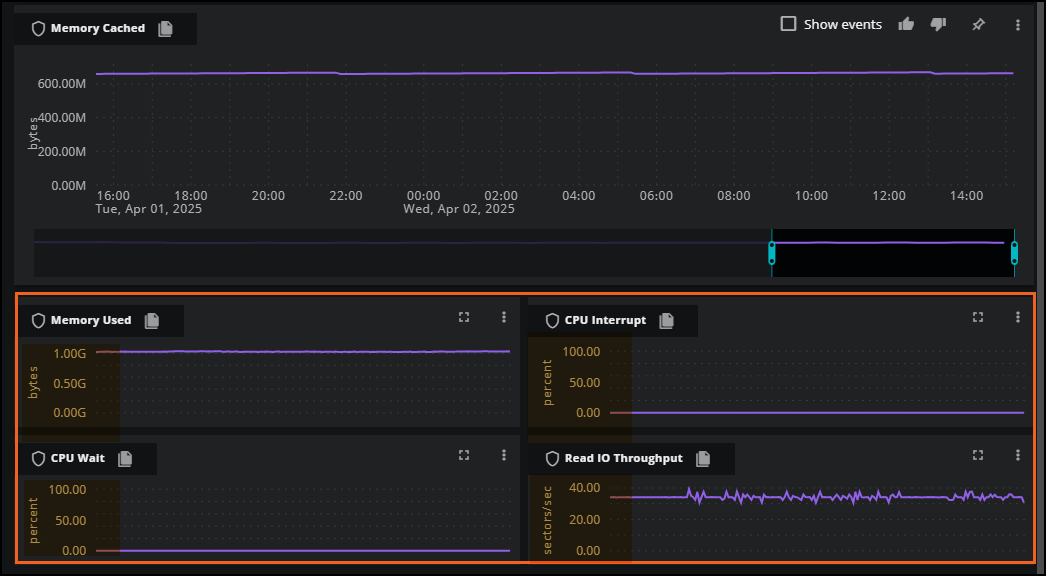
To learn more about secondary metric cards, see Smart View.
Actions > Destinations
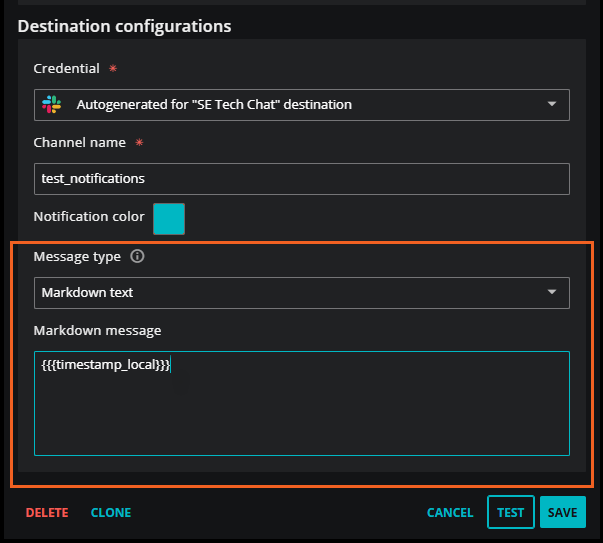
You can now add a custom message to your notification when creating a new Slack destination or editing an existing one. This is useful when you want to add more details to your message or take advantage of Slack customizations.
In the destination details, you can select the default Slack message format, plain text, markdown text, or JSON blocks for your message format. After selecting the message type, you can enter your custom message.
To learn more, see Destination fields for Slack.
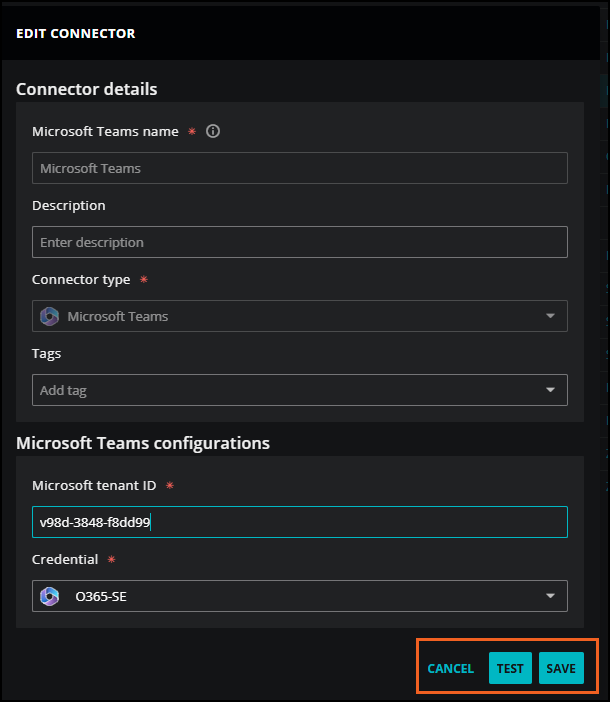
Streaming data > Connectors
When adding or editing a connector, you can test your new or updated configuration for a connector before saving it. This is useful for troubleshooting configuration changes before they are saved. The TEST button is available for all connectors.
To learn more, see Connectors.
Streaming data > SAM collector
You can configure the Site Availability Monitor (SAM) collector to monitor both external and internal sites and endpoints. The SAM collector allows you to monitor the availability of internal sites, such as servers, network devices, and applications, from within your firewall.
To use the SAM collector, install the Linux agent and configure the http datasource.
To learn more, see Site Availability Monitor (SAM) collector.
March
This month's updates include the following enhancements:
Events
You can now filter the First seen and Last seen columns by date and time. Click the calendar option in the column header to apply a date range to search for events within your specified range. Alternatively, you can select a single date and corresponding time to search for events before or after the specified date. The filters work independently for each column, but you can use both together to create a custom range.
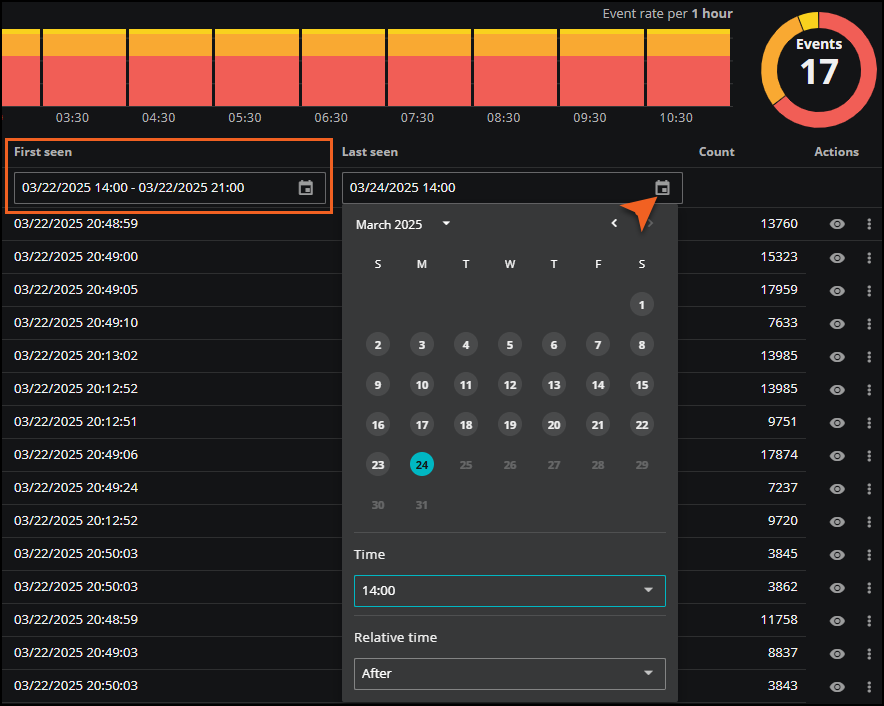
This feature is useful when you want to fine-tune the existing time range for the console. For example, you can include only events first seen in the last 24 hours instead of all open events in the default time range.
To learn more, see Events.
Smart View
You can now navigate back to recently viewed entities. This is useful when you have examined entities in Smart View in past sessions and would like an easy way to find them again.

There are multiple ways of navigating to Smart View, such as clicking an entity or link in Dashboards, Events, or Inventory. All instances where an entity serves as the anchor entity in Smart View are tracked. As a result, you can quickly select the most recently and frequently viewed entities when you open the Smart View landing page.
To learn more, see Smart View.
Inventory > Summary view
You can now view a visual summary of the entities included in your query. This is useful when you want a quick snapshot of key information about your query results.
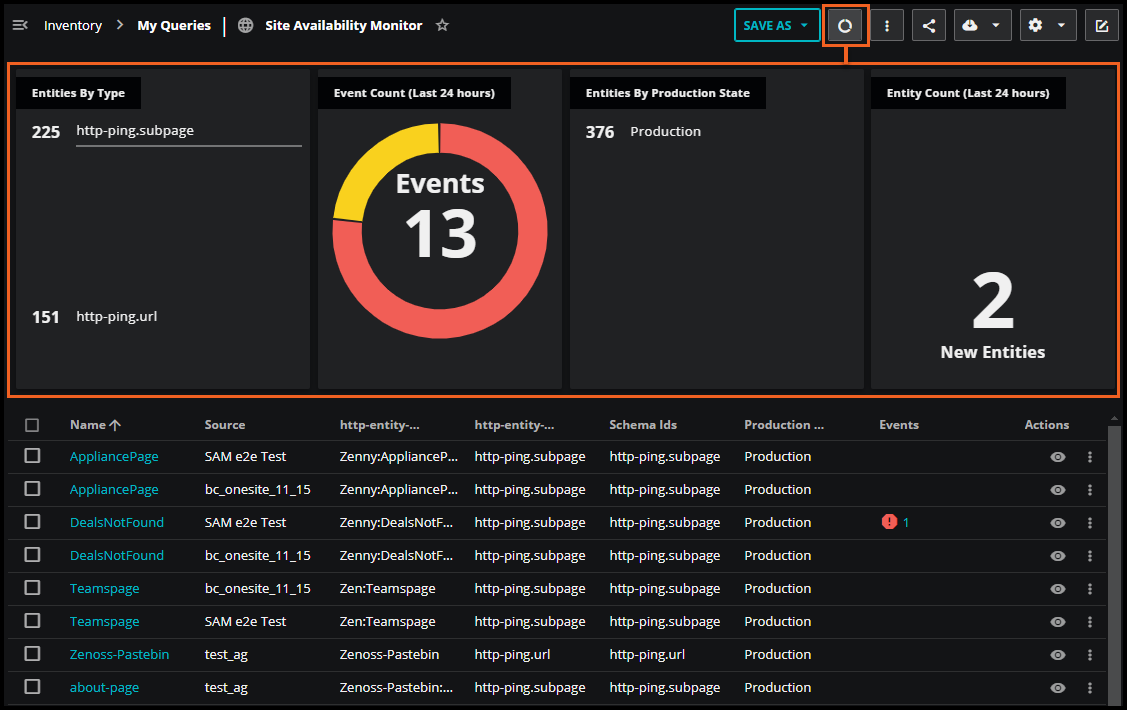
To learn more, see View summary.
Dashboards > Save scope filters
When you are refining the scope of your dashboard using the expanded scope filter, you can now save that filter to the dashboard scope.
Click the Expand scope filter bar to open the query builder to specify the criteria of the entities you want to view. To keep this filter as part of your dashboard scope, click the Save icon in the query bar.
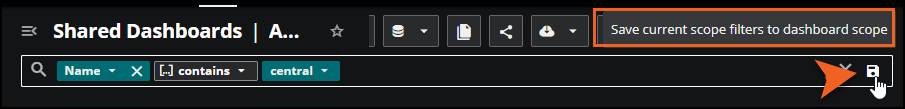
When you next open this dashboard, the filter is automatically applied to the dashboard scope. You can also select the scope control to view the scope and its filters.
To learn more, see Filter the dashboard scope.
Dashboards > Add filters in dashboard scope
You can now add filters when defining or editing the scope for a dashboard.
When creating a new dashboard or editing an existing dashboard, you can add, edit, or delete filters. This is useful when you want to adjust the entities included in your current scope or if you want to modify or delete filters you have applied.
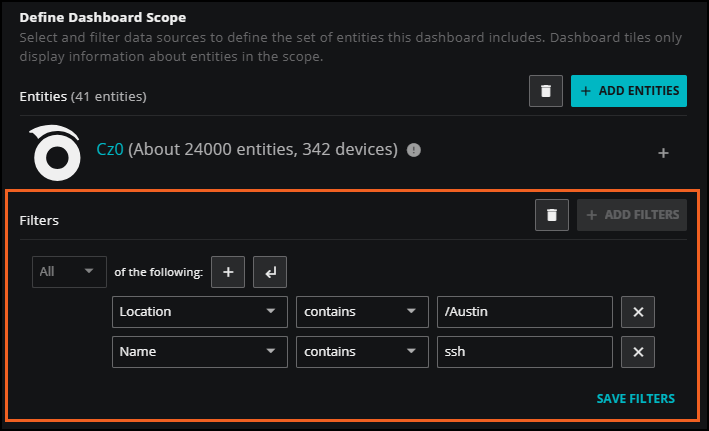
To learn more, see Create a new dashboard and Edit the dashboard scope.
Dashboards > Tile filters
You can now apply filters to individual tiles in your dashboard. This is useful if you need to compare different services side-by-side, for example, comparing the performance of services in different regions.
You can apply tile filters on all tile types except Clock, Emoji, and Notes. When you apply a tile filter, it will remain active for all future sessions.
You can add, modify, and delete tile filters in Tile Configuration.
To learn more, see Filtering dashboard tiles.
February
This month's updates include the following enhancements:
Actions > Destinations
You can now select a time zone and a time format for your destinations in Actions. This is useful when you want your notification summary to include days, dates, or timestamps.

To learn more, see Add a destination.
You can also insert the new {{{timestamp_local}}} template in messages. To learn more, see Message templates.
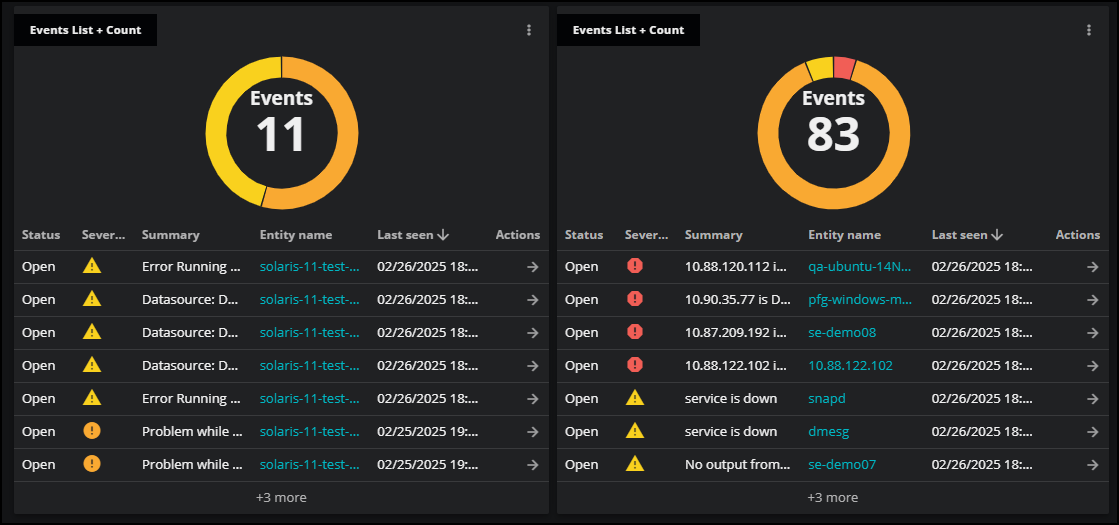
Dashboards > Service Health tile
You can now view availability and performance percentages in the Service Health tile. These percentages indicate the proportion of time that the service is considered available and performant. This information gives you a quick and easy way to assess the health of your services.
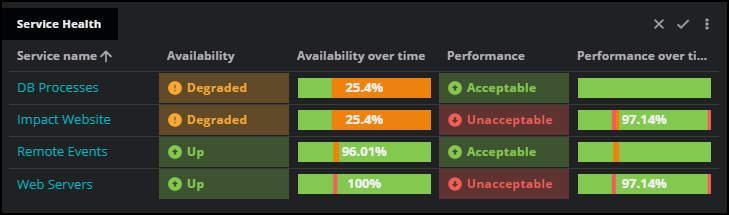
You can customize the types of events that are included in these classifications in the Tile Configuration panel for the tile. For example, you can decide to never show percentages, or to only show percentages when a service is below 100%. You can also set minimum states for services to be considered available and performant.
To learn more, see Service Health tile.
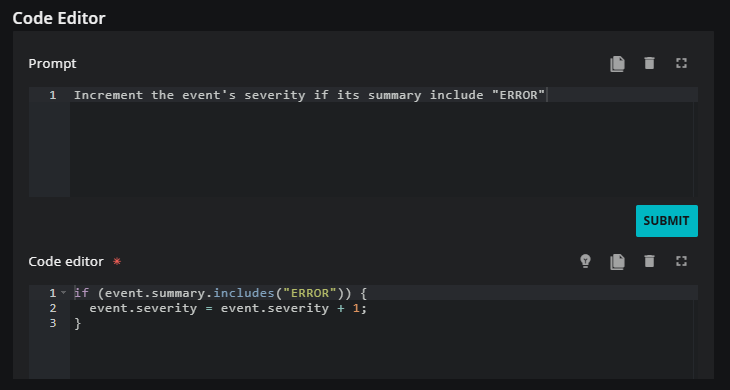
Administration > Event management
You can now use our code assistant to help you craft your Javascript code when customizing event ingest policies.
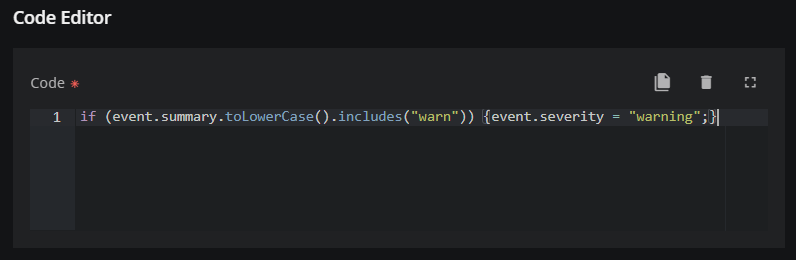
When you're checking out your events, you might want to adjust them a bit for the next time they pop up. For example, you might want to change the severity of an event or tweak the summary, but you don't know the exact Javascript to use in the Code Editor.
With the code assistant, you can just type what you want to do in plain English, and the AI assistant will generate some Javascript code for you. It offers a great starting point, but you might need to modify your instructions or the code itself to get it working just right.
To learn more, see Code assistant.
Inventory > Events column
In the Events column in Inventory, you can now view event information about entities, including the severity and event count scoped to the entity.
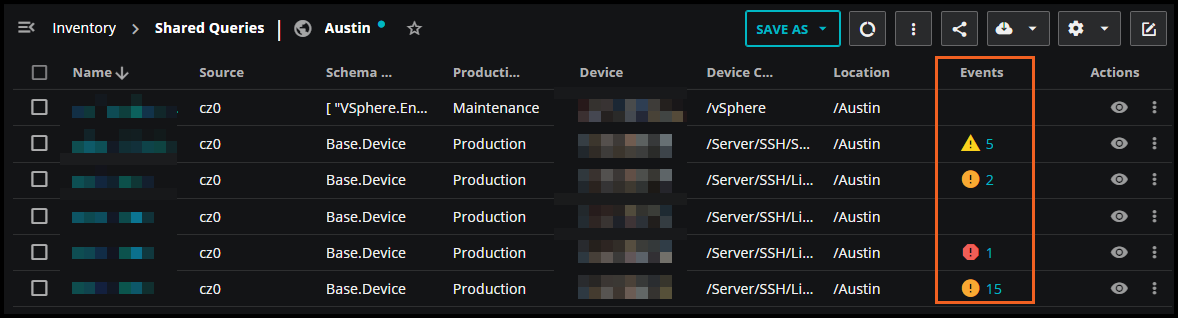
The row for each entity shows the icon for the highest severity level of its associated events, along with the total number of matching events. You can click the severity icon to go to the Events console and view details for critical, error, and warning events.
To learn more, see Inventory.
January
This month's updates include the following enhancements:
Actions > Destinations > PagerDuty
You now have the power to customize PagerDuty alert summaries to ensure that critical information is always front and center. When editing your PagerDuty destination, set a custom summary template or let Zenoss supply a default template that corresponds to the trigger type.
We've also expanded our documentation to include the Custom Payload option for the PagerDuty destination. This option gives you the ability to add additional context and data within the PagerDuty incident payload.
To learn more, see Add a destination and Destination fields.
Site Availability Monitoring (SAM) connector
Configuring your SAM connector is improved. When you set up your SAM connector, you can now add your configuration file in the new Code Editor and enter the credentials for your site or sites.
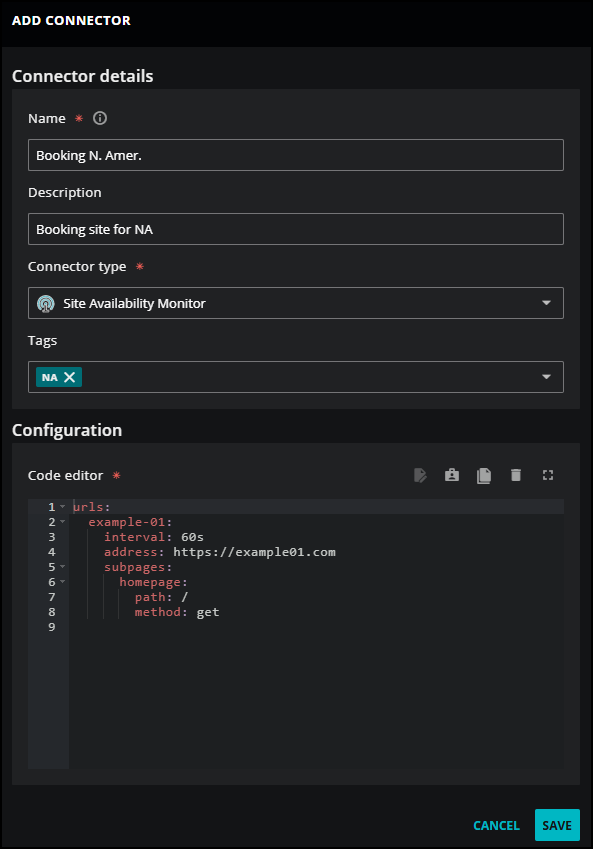
The Code editor includes options for building your configuration file using a sample YAML file, showing the credentials matcher for adding and editing site credentials, and copying your configuration file before saving the connector.
To learn more, see Set up a Site Availability Monitor (SAM) connector
Connectors and multiple credentials
A connector can be associated with multiple credentials, for example, a Site Availability Monitoring (SAM) connector might be configured for multiple sites, each with unique credentials. In such cases, the Credentials column in the Connectors table displays the link text multiple credentials for that connector. Click the link to open the Credentials service so you can view a filtered table of the associated credentials.
Credentials are only filtered for connectors created or edited after December 19th, 2024. When you create a new connector with multiple credentials or edit an existing connector, Zenoss automatically adds the connector name to the Tags field. Zenoss uses these tags to filter multiple credentials. If you don't have changes to make for your connector, you can manually add a tag (connector name) to your credentials for the connector. Then credentials filtering works.
To learn more, see Viewing connectors.
Past update notes
Looking for last year's feature releases? See 2024 update notes.