Site Availability Monitor (SAM) connector
Virtana Service Observability provides the SAM connector so you can monitor the uptime of your cloud-based web applications and notify business and application owners and administrators of problems before they impact your organization.
Note
If you want to monitor both external and internal sites and endpoints, then consider configuring the Site Availability Monitor (SAM) collector. The SAM collector monitors the availability of internal sites, such as servers, network devices, and applications, from within your firewall.
If monitored sites are unreachable, degraded, or down, the system automatically creates events that are viewable in the Events console. Here are a few possible example events:
-
A critical event is generated if the main URL is inaccessible, indicating the reason why, such as a DNS error or bad address.
-
An error event is generated if a subpage is unavailable.
-
A warning event is generated if a subpage is degraded.
-
An info event is generated when the main URL or subpage is available.
For more information, see Site Availability Monitor in Dashboards.
Before you begin
As a best practice before setting up your connector, check that your service allows the source IP address from where you expect connections. See Before setting up your connectors for the list of IP addresses and more information.
As part of setting up the connector, you add a configuration file that includes one or more sites to monitor. After you add your SAM connector, Virtana Service Observability uses the Site Availability Monitor template to create your dashboard. For more information, see Site Availability Monitor (SAM).
Set up a Site Availability Monitor (SAM) connector
Perform the following steps to set up your Site Availability Monitor (SAM) connector.
Note
Your account must be assigned the Manager role to create and manage connectors.
-
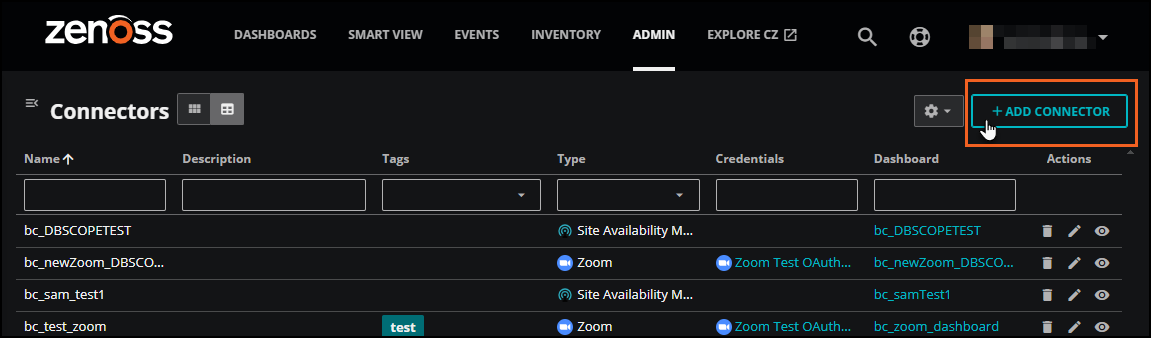
Log in to Virtana Service Observability as a user with the Manager role, and then open the ADMIN > Connectors page. Click ADD CONNECTOR.
-
On the SELECT CONNECTOR TYPE dialog box, click the Site Availability Monitor card. The ADD CONNECTOR dialog box opens.
-
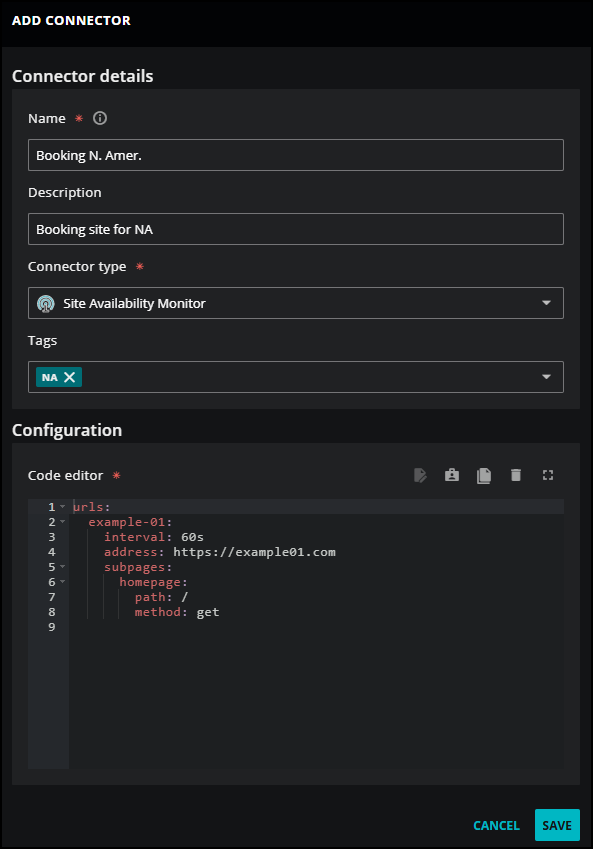
In Site Availability Monitor details, add information about your application.
-
In the Name field, enter a unique name for your connector. The name you choose is used as the source name for the data that Virtana Service Observability collects.
-
(Optional) In the Description field, enter text to associate with your connector.
-
Keep the Connector type as Site Availability Monitor.
-
(Optional) In the Tags field, enter one or more terms to associate with your connector.
-
-
In Configuration, you can add your configuration file in the Code Editor and enter the credentials for your site or sites. You can associate multiple credentials for a single connector.
-
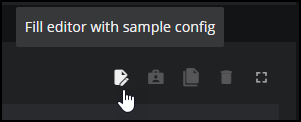
Click the Fill editor with sample config button to use a sample configuration file.
SAM configuration files are written in YAML. Customize the file using the SAM connector configuration options.
-
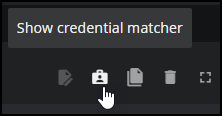
Optionally, click the Show credential matcher to show the credential fields in your file.
Click the Credential field to select an existing credential or create a new one. When you choose Create new credential, the dialog box expands to include fields for creating new credentials for SAM. Be sure to save any credentials you create here.
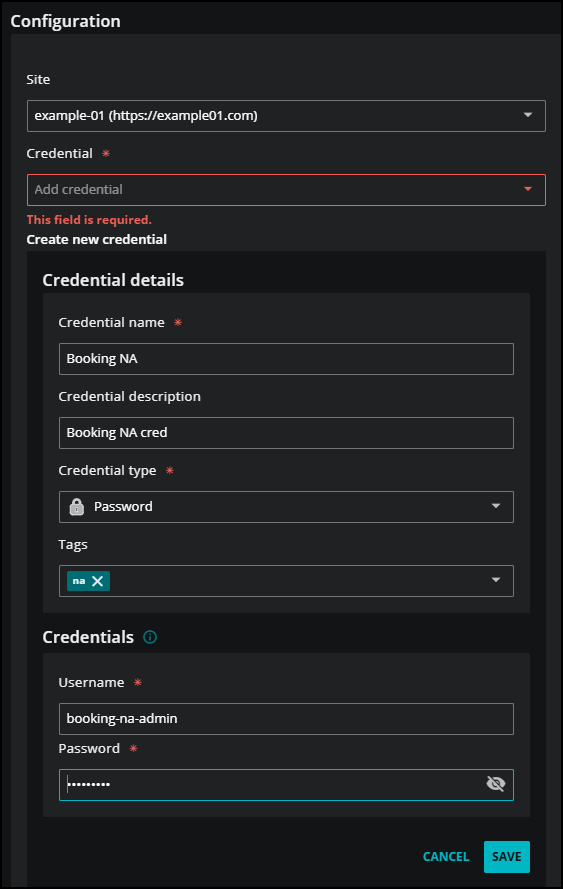
For more information about creating new credentials, see Add password credentials and Add API key credentials.
-
Optionally, at any time you can select Clear to empty the contents in the code editor, or click Fullscreen to enlarge the code editor window.
-
When finished wtih your configuration file, you can click Copy to clipboard to save and store it locally.
-
-
(Optional) Click TEST to test your configuration before saving. A success or error message appears.
-
Click SAVE. A confirmation dialog box appears, asking you if you want to create a new dashboard.
-
(Optional) In the confirmation dialog box, choose CREATE DASHBOARD to create a new dashboard using the SAM template for your connector.
-
In the NAME DASHBOARD dialog box, enter a unique name for your dashboard.
-
When you see the success message, click DASHBOARDS to view your dashboard for the SAM connector. Virtana Service Observability creates the dashboard using the Site Availability Monitor template, so your dashboard might look similar to the following image:
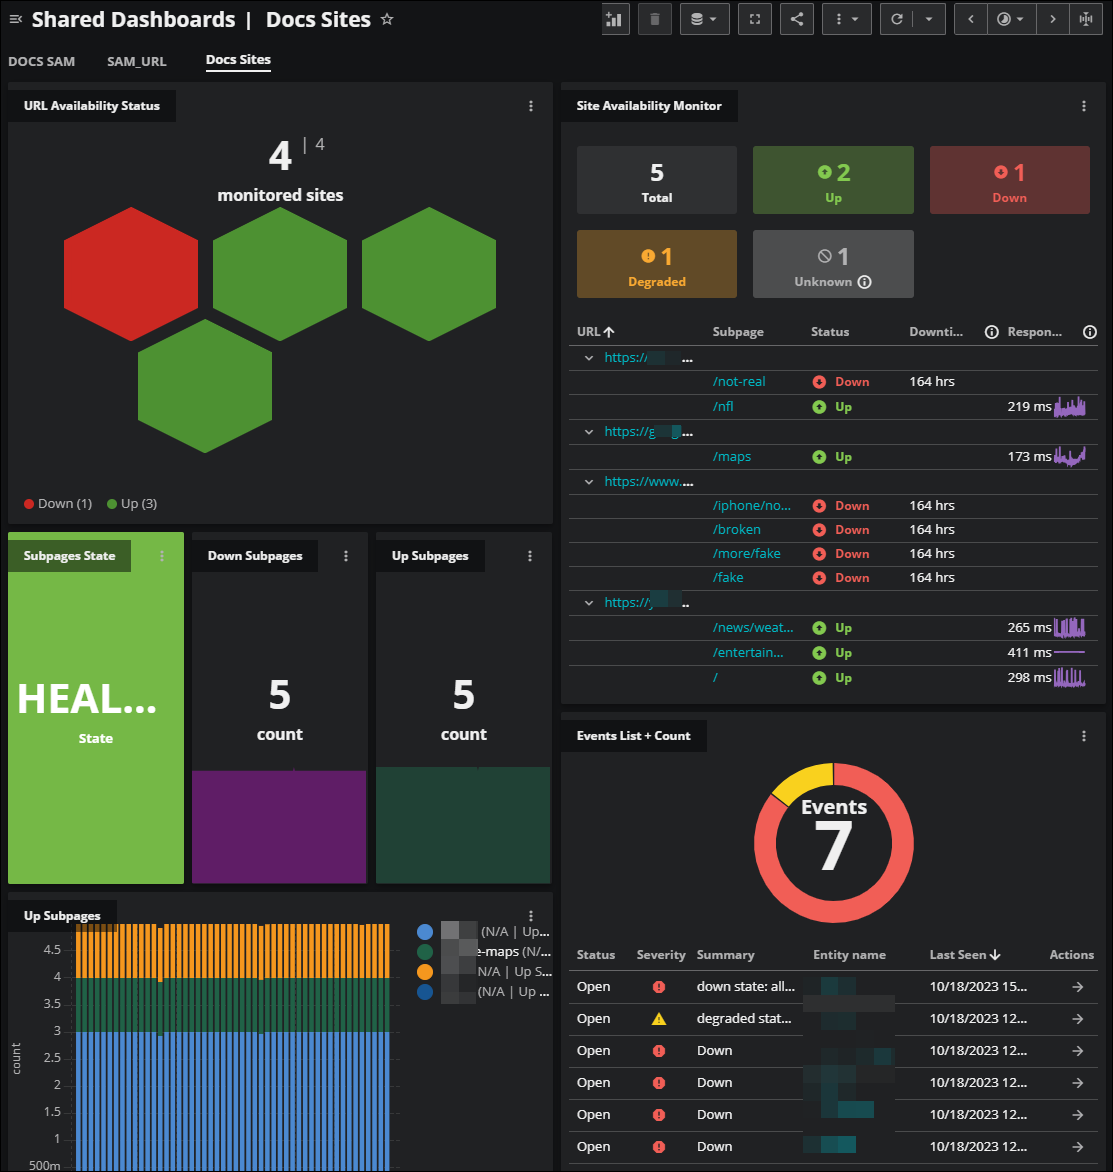
For more information about the default SAM dashboard template, see Site Availability Monitor template.
-
SAM connector configuration options
You can use a single configuration file to monitor multiple URLs (example-01 and example-02) and their accompanying credentials.
Optionally, you can set redirection and content parameters for a site or for specific subpages. These parameters are useful if you want to fine-tune site availability monitoring when your sites are redirected. For example, your site might automatically redirect to a temporary "site down" page. In this case, you can configure these parameters to indicate that the site is down in your SAM dashboard tile even though a site page was reached.
If needed, you can insert the delete option in the configuration file to remove URLs and subpages.
See the sample configuration file if you need help formatting these options in your YAML file.
About URL names in SAM tiles
Within the SAM tile in Dashboards, you have the option to display either the full URL path or a shortened URL name. Both of these values are derived from the configuration file.
Consider the following snippet from a configuration file:
urls:
  example-02:
    interval: 2m
    address: https://example02.org
    send_metrics: false
    subpages:
      anything-red:
        path: anything/red/
        method: get
For URL paths within this configuration:
-
Short URL Name:
example-02. -
Long URL Name: The value for
address, which ishttps://example02.org.
For subpages within this configuration:
-
Short URL Name:
anything-red. -
Long URL Name: The value for
path, which isanything/red/.
URL configuration options
Use the following tables of URL configuration options and values to set up your web applications with SAM.
Note
A valid URL address can't contain any subpages. Any text after the top level domain is discarded.
| Option | Values | Description |
|---|---|---|
interval |
integer followed by s, m, or h |
The cycle time in seconds, minutes, or hours used to poll the URL and any defined subpages. |
address |
http:// or https:// |
The URL to be polled. A valid URL address can't contain any subpages. Any text after the top level domain is discarded. |
insecure |
boolean (true|false) |
Set this flag to true to enable the URL and its subpages to skip certificate validation. Set to false if you don't want to skip certificate validation. This setting is useful when you are monitoring a site that uses a nonstandard certificate, such as a self-signed certificate, which you might use in testing environments. This is an optional setting. The default value is false. |
ping_timeout |
integer followed by s, m, or h |
The amount of time that the data source waits for a response from the URL before timing out. This value overrides the global setting of 10s. |
send_metrics |
boolean (true|false) |
Set this flag to true to enable the URL and its subpages to collect and send metrics. Set to false if you do not want to collect and receive metrics. This is an optional setting. The default value is true. |
Note
Sometimes, a URL without a subpage is unreachable because of network, DNS, or site errors. In such cases, Virtana Service Observability sends an event indicating that the site is down.
Credentials options
You can use the credentials parameters to specify a login method and authentication values. Supported authentication methods include HTTP basic, HTTP bearer, and API keys.
A failure event is generated if the supplied credentials fail to validate with the target URL.
Basic Authentication
Basic authentication is a simple HTTP authentication scheme that sends credentials as user ID/password pairs in an encoded (not encrypted) string. In the configuration file, basic authentication uses the type: basic-auth parameter with the login and password parameters.
Note
In Virtana Service Observability, you can only perform basic authentication at the domain level. It does not work for subpages.
| Option | Value | Description |
|---|---|---|
type |
basic-auth |
Sets the authentication mode to HTTP-basic using the Authorization: Basic field. |
login |
string | A user ID allowed by the target URL. |
password |
string | The password for the user ID specified by login. |
Bearer Authentication
Bearer authentication (sometimes called token authentication) is an HTTP authentication scheme that uses access tokens called bearer tokens. When you use bearer authentication, you are granting permission to the "bearer" of this token to access protected resources. The bearer token is a cryptic string in the Authorization header. It’s widely used for securing API access.
In the configuration file, bearer authentication uses the type: api-key parameter, as well the key_prefix: <prefix_value> and key: <token_value> parameters. A common format of the bearer token in the header might be:
Authorization: Bearer {token_value}
| Option | Value | Description |
|---|---|---|
type |
api-key |
Sets the authentication mode to HTTP-bearer using the <prefix_value> field. |
key_prefix |
string | The token prefix expected by the target URL. |
key |
string | An authentication token. |
API Keys
API key authentication uses an API key to authenticate to an API.
In the configuration file, API key authentication uses the type: api-key and key: <API_key> parameters, and the field : <X-API-Key> parameter.
| Option | Value | Description |
|---|---|---|
type |
api-key |
Sets the authentication mode to API key using a user-supplied field. |
field |
string | The name of the field expected by the URL. |
key |
string | The API key to supply to the URL. |
Note
Both HTTP-bearer and API key authentication use the type: api-key and key parameters. However, they differ in their use of subsequent parameters: key_prefix for bearer mode and field for API mode.
Metadata options
You can add metadata to a site or a subpage in the form of one or more key-value pairs. Add the key and its value to the site or subpage entities as attributes. Metadata is only used to add information to an entity and has no effect on monitoring.
| Option | Values | Description |
|---|---|---|
metadata |
one or more key-value elements | Keys and their values will be added to the URL entity. |
Note
If the same key is used on a site and on one of its subpages, the subpage
value will override the site value.
Subpage configuration options
Subpage configuration options include the following:
| Option | Values | Description |
|---|---|---|
path |
string with no leading / character. If you want to monitor the root of a website, set this value to / only. |
The path to an individual page or root of a website that the connector should monitor. |
method |
string (get|post) |
The HTTP method that the connector uses to poll the page. |
event_body_limit_bytes |
2048 (default) | Define how many bytes of the response to attach to a warning, error, or critical event for a subpage. You can use this parameter to limit the size of the response to an error event. This is an optional parameter. |
Redirection options
Redirection configuration options include the following:
| Option | Values | Description |
|---|---|---|
follow_redirections |
boolean (true|false) |
Set this flag to true to accept when this page redirects to another page or pages. Set to false to reject when this page redirects to other pages. When set to true, the site status in your SAM dashboard tile maintains a status of "Up" when the site redirects to another page. Additionally, when this parameter is set to true, it overrides the fail_on_redirections parameter. |
fail_on_redirections |
boolean (true|false) |
Set this flag to true to reject when this page redirects to another page or pages. Set to false to accept when this page redirects to other pages. This parameter works together wtih the follow_redirections parameter: If the follow_redirections parameter is set to false and the fail_on_redirections is set to false, then the site in the SAM dashboard tile maintains a status of "Down" and the redirect status code is returned. If the follow_redirections parameter is set to true and the fail_on_redirections parameter is set to false, then the site has a status of "Up". |
max_redirections |
integer | The maximum number of times a site is permitted to redirect to another page before impacting the site status in the SAM dashboard tile. To activate redirection, set a value of 1 or greater. If you set this parameter to 0, redirection is deactivated. |
redirect_location_pass |
string | Enter the name of the redirecton site that is allowed. When this final destination is reached through redirection, the status of the site in the SAM dashboard is "Up". |
redirect_location_fail |
string | Enter the name of the redirection site that is disallowed. When this destination is detected within a chain of redirections, the status of the site in the SAM dashboard is "Down". |
payload_match_pass |
string or regex | Enter a string or regular expression for Virtana Service Observability to search. If it is found, the site is allowed and the status of the site in the SAM dashboard tile is "Up". If it is not found, the status of the site in the SAM dashboard tile is "Down". |
payload_match_fail |
string or regex | Enter a string or regular expression for Virtana Service Observability to search. If it is found, the site is disallowed and the status of the site in the SAM dashboad tile is "Down". If it is not found, the status of the site in the SAM dashboard tile is "Up". |
Content options
You can use the content parameters separately or jointly with the redirections parameters. This group of content parameters work together to provide the criteria for a specific action. You can specify the text to search, where to find it, how many times to find it, and what action to perform when the criteria is met.
Content configuration options include the following:
| Option | Values | Description |
|---|---|---|
content_match |
string | Enter the text that you want to search on the site in order to perform a specific action. For example, you might want to enter "site down" as the text to find if you want to set the monitoring status to "Down" in the SAM dashboard when this text appears on the page. |
content_location |
string | Specify the location of the text in the content_match parameter. You can specify headers, the name of a specific header, or body. The default value is body. |
expected_matches |
integer | Enter the exact number of matches to find on the site. When Virtana Service Observability finds this exact number of matches, it performs the action specified in the action_on_match parameter. The default value is 1. |
action_on_match |
pass|fail |
Enter the action to perform when the criteria from the other three content parameters is met. If you enter pass, the site is allowed and the status in the SAM dashboard tile is "Up". If you enter fail, the site is disallowed, and the status in the SAM dashboard is "Down". The default value is fail. |
Status parameters
The SAM Connector is configured with default ranges of response codes to indicate when a site has a status of Up and when a site has a status of Down.
-
When the response code is in the range of 100-299, the site is assigned a status of Up.
-
When the response code is in the range of 300-599, the site is assigned a status of Down.
For a specific site or subpage, you can define response codes that you want to exclude or include in these ranges. For example, you might have subpages which send custom status codes. In these cases, use the exclusions or additional parameters.
Note
As a best practice, only specify status codes for exclusion and inclusion when you want to change the default ranges.
| Option | Values | Description |
|---|---|---|
exclusions |
a list of HTTP response code(s) | You can add response codes to exclude from either the up range or the down range. |
additional |
a list of HTTP response code(s) | You can add response codes to include in either the up range or the down range. |
Example of status parameters
In the following example, the SAM connector is configured for the following exceptions to the default up and down ranges for a site or subpage:
-
In the
uprange, exclude the response codes of298and299from the default range of 100-299, and include the response code of308. -
In the
downrange, exclude the response code of418from the default range of 300-599 and include the response code of266.
status_params:
  up:
    exclusions:
      - 298
      - 299
    additional:
      - 308
  down:
    exclusions:
      - 418
    additional:
      - 266
If a response code of 298, 299, or 266 is returned, the status will be Down for the site. If a response code of 308 or 418 is returned, the status will be Up for the site.
Data options
When using method: post on a subpage, you can use the data parameter to specify a list of key-value pairs.
These keys and their values are reformatted as a JSON object and sent to the subpage as a data payload, for example, Content-Type: application/json.
| Option | Values | Description |
|---|---|---|
data |
one or more key-value elements | Configured key-value pairs are sent to the subpage as a JSON payload. |
Metadata options for subpages
You can add metadata to a site or a subpage in the form of one or more key-value pairs. Add the key and its value to the site or subpage entities as attributes. Metadata is only used to add information to an entity and has no effect on monitoring.
| Option | Values | Description |
|---|---|---|
metadata |
one or more key-value elements | Keys and their values will be added to the subpage entity. |
Note
If the same key is used on a site and on one of its subpages, the subpage
value will override the site value.
Sample configuration file
Use the following sample YAML configuration file to assist you in creating your own configuration file in the code editor.
urls:
  example-01:
    interval: 30s
    address: https://example01.com
    send_metrics: true
    credentials:
      # For api keys on other headers:
      type: api-key
      field: X-API-Key
      key: myApiKeyValue
      # or, for http basic-auth:
      # type: basic-auth
      # login: myUsername
      # password: myPassword
      # or, for http 'bearer' type authentication:
      # type: api-key
      # key: myBearerTokenValue
      # key_prefix: Bearer
    redirection_params:
      follow_redirections: true
      fail_on_redirections: false
      max_redirections: 5
      redirect_location_pass: www.example01.org
      redirect_location_fail: www.failing-example.com
      payload_match_pass: "Example for pass"
      payload_match_fail: "example for fail"
    content_params:
      my-content-test:
        content_match: unavailable
        content_location: body
        expected_matches: 1
        action_on_match: fail
    metadata:
      name: example-1
    subpages:
      anything-blue:
        path: anything/blue/
        method: get
        metadata:
          # as a best practice, include the complete address as a user-defined metadata field so you can understand which URL address is being pinged.
          myaddress: https://example01.com/anything-blue/anything/blue/
          myfield1: test
        status_params:
          # specify any exclusions to the default rules here.
          up:
            additional:
              - 777
              - 888
          down:
            exclusions:
              - 308
      anything-yellow:
        path: anything/yellow/
        method: post
        # Provide any HTTP POST method data to be sent in the request. Data will be sent as simple JSON.
        data:
          data_string_1: "test data"
          data_integer_1: 1000
  example-02:
    interval: 2m
    address: https://example02.org
    send_metrics: false
    subpages:
      anything-red:
        path: anything/red/
        method: get
        redirection_params:
          follow_redirections: true
          fail_on_redirections: false
          max_redirections: 5
          redirect_location_pass: www.example02.org
          redirect_location_fail: www.failing-example02.com
          payload_match_pass: "Example for pass"
          payload_match_fail: "example for fail"
        content_params:
          my-content-check-foo:
            content_match: foo
            content_location: headers
            expected_matches: 2
            action_on_match: pass
Delete SAM connector configurations
You can now modify or remove a configuration for a URL and/or subpage using the delete YAML option. This feature removes associated entities on both the URL and subpage levels.
-
To delete entities for a URL and its subpages, apply the
deleteoption at the URL level. -
To delete entities for specific subpages, apply the
deleteoption at the subpage level for the desired subpage or subpages.
For instance, to remove a URL and its associated subpage entities, insert delete at the URL level. To delete only a temporary subpage entity, insert delete in the specific section. In the following example, the delete option will remove the entities for the myurl and its subpages:
urls:
  myurl:
    interval: 90s
    address: https://www.example.com
    delete: true
    subpages:
      root:
        path: /
        method: get
      temp:
        path: /temporary
        method: get
Using the delete option is a best practice for keeping your system clean and clear of redundant site names.
To delete existing entities, follow this workflow:
-
Add
deleteto an existing subpage or URL in the connector's YAML file. -
Run the connector and verify that the entity has been deleted from Inventory.
-
Remove the URL or subpage definition from the connector YAML.
Note
Entities might continue to appear on the SAM tile until their definitions are removed from the YAML file.
If you remove a URL or subpage from the YAML file without using the delete option first, you can always re-add the definition with the delete option later. Keep in mind that just deleting the URL or subpage section from your connector YAML file will not trigger a model deletion from Collection Zone (CZ), meaning that the entity or entities will remain in your Inventory.
To add the definition back with the delete option, perform the following steps:
-
Open the YAML connector file.
-
Insert the previously removed lines of text that define the URL and/or subpages.
-
Add the
deleteoption to the re-added definition. For example, if you removed thetemp:subpage in the previous example file, then you would add the subpage section back in the file and insert thedeleteoption so you can delete the entities from your Inventory.
urls:
  myurl:
    interval: 90s
    address: https://www.example.com
    subpages:
      root:
        path: /
        method: get
      temp:
        path: /temporary
        method: get
        delete: true
Note
Entities will automatically age out and be removed from Inventory after their retention period ends, which is typically 90 days.
SAM metric data
You can view the metrics for the SAM connectors in the following tables:
URL metrics
| Metric | Metric label | Units | Description |
|---|---|---|---|
| ping.http.avg_resp_time | Average Response Time | ms | The average response time for all up subpages. |
| ping.http.conn_time | Connection Time | ms | The connection time for the URL. This metric measures the time taken to establish a connection to the URL. |
| ping.http.down_subpages_count | Down Subpages | count | The total number of subpages that are currently down or unreachable. |
| ping.http.max_resp_time | Maximum Response Time | ms | The maximum response time among all the up subpages. |
| ping.http.min_resp_time | Minimum Response Time | ms | The minimum response time among all the up subpages. |
| ping.http.up_subpages_count | Up Subpages | count | The total number of subpages that are currently up and reachable. |
Subpage metrics
| Metric | Metric label | Units | Description |
|---|---|---|---|
| ping.http.subpage_error_code | Error Code | count | Tracks the HTTP error codes returned by the URL subpage in response to HTTP requests. Monitoring these codes can help identify issues with the subpage. |
| ping.http.subpage_response_time | Response Time | ms | Measures the time taken for an HTTP request to be sent to the URL subpage and for a response to be received. This metric is useful for monitoring the performance and latency of the URL subpage. |
| ping.http.subpage_state | State | enumeration | Represents the availability or reachability of the URL subpage using a Boolean value. A value of 1 indicates that the subpage is "UP" (online and operational) and a value of 0 signifies that the subpage is "DOWN" (unreachable or non-functional). This metric is useful for monitoring the URL subpage's availability and health. |
| ping.http.subpage_up_code | Up Code | count | Tracks the HTTP status codes returned by the URL subpage that indicate successful responses. Monitoring these codes helps ensure the subpage is functioning as expected. |