About dashboards
A dashboard is a collection of tiles that display key indicators of a set of entities over a range of time. Indicators include metric graphs, status tables, lists, maps, notes, and more. You create dashboards to provide status information about your environment as a whole, about key components of your infrastructure, and about critical services. To get started quickly, you can copy an existing dashboard or one of our templates.
Info
The Collection Zone dashboards feature will be retired on December 15, 2025. We recommend using Cloud Dashboards for monitoring key indicators of your entities.
Scope
You define the set of entities a dashboard includes with a query. This is the dashboard's scope. A scope query combines sources of data with optional filters. A few example scopes include:
- Everything monitored through Collection Zone 0 (
cz0) - The devices in the group organizer named Marketing Systems in
cz0
The indicators that you select for a dashboard might not display information about all the entities included in a dashboard's scope. However, they also won't display information about entities that are outside the scope.
Scope type
You can use a current or an historical scope for a dashboard:
-
A current scope query examines only the current state of your environment.
For broadly-defined scope queries of large environments, a current scope returns results more rapidly than an historical scope. Since the scope query only considers the current state, entities or organizers that have been deleted are not found. Current scope is the default scope.
-
An historical scope query examines the state of your environment during the dashboard's current time range.
All entities and organizers that existed during the time range are uncovered, regardless of whether they exist right now. This makes historical scopes most useful for investigations, rather than for displaying the current state of your environment.
Note
The scope type does not affect the time range. Metric and event data are always selected from the time range you select, regardless of whether the scope is current or historical.
Scope filters
You can further refine the scope using the dashboard scope filters.
When you are investigating an incident, you can refine the data in the dashboard. For example, you might want to view data only for entities in a specific region. When you apply a scope filter, all dashboard tiles are modified to show the data that matches your filter criteria.
For example, you might have a dashboard to monitor all your devices in Europe, and you receive a notification about a service disruption in Paris. To investigate, you can refine the dashboard scope by opening the scope filter and building a query of "Location starts with /Paris".
You can add scope filters in a couple of ways:
-
In your dashboard, click the Expand scope filter bar to open the query builder, then create a query to narrow the entities to just those that you want to view in your dashboard tiles. You can keep this filter as part of your dashboard scope by clicking the Save icon in the query bar. When you next open this dashboard, the filter is automatically applied to the dashboard scope. For more information, see Filter the dashboard scope.
-
You can also add filters when defining or editing the scope for a dashboard. In your dashboard, open the Dashboard scope panel. Here you can see the current scope and any applied filters. To make and save changes, click EDIT SCOPE. For more information, see Edit the dashboard scope.
Time range
A time range determines which metric and event data are displayed in a dashboard. For historical scope, a time range also determines which entities are included in a dashboard. You define a dashboard's time range with the time range settings. When you choose a range of time, Virtana returns all results that are within the time range and within your data retention period.
Note
For specific details about your organization’s data retention period, contact your Virtana Support representative by opening a support ticket.
Each dashboard's time range is independent of every other dashboard's time range. For example, wWhen you select an entity link in a dashboard tile to open the entity's Smart View page, the Smart View time range matches the dashboard time range.
Additionally, you can pin a default time range to a specific dashboard so it always opens with the same time range. Click Save time range (pin icon) to save the configured time range for the selected dashboard. Click it again to discard the saved time range.
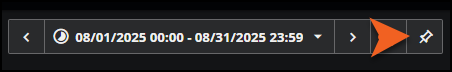
You can pin a time range for a specific set of dates, such as August 1-31, or you can choose a relative time range. If you pin a relative time range such as "Last 7 Days", the pinned time range will always be relative to the current time. So, if you open it next week, it will show the last 7 days from that point.
Templates
Dashboard templates provide useful starting points for common dashboard scenarios. Rather than build a dashboard from scratch, you can just copy a template and customize it for your environment.
Dashboard templates are created by Virtana. Only copies of dashboard templates can be edited or deleted. For more information, see the template copy procedure.
Tiles
Tiles provide snapshots of your data in your dashboards.
Learn more about tiles.
Tutorials
Are you new to Virtana Service Observability dashboards? Use the following tutorials for a hands-on experience creating dashboards:
- Create a dashboard for Linux hosts in an organizer
- Create a Graph tile for a specific entity and metric
If you just need a refresher, see Create a new dashboard.
Opening Dashboards
You can create and view dashboards from the following locations:
- The Virtana Service Observability header is visible on all tabs. In the header, click DASHBOARDS.
Note
Your account must be assigned the Read Only User role or a more privileged role to view public dashboards in the DASHBOARDS tab. Your account must be assigned the User role or a more privileged role to create dashboards, copy a dashboard template, or edit or delete any user’s public dashboard.
Tour of Dashboards
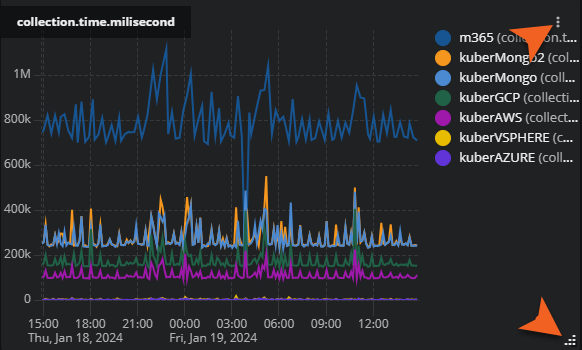
The indicators on dashboard pages are displayed in rectangular tiles, which you can size and arrange as desired.
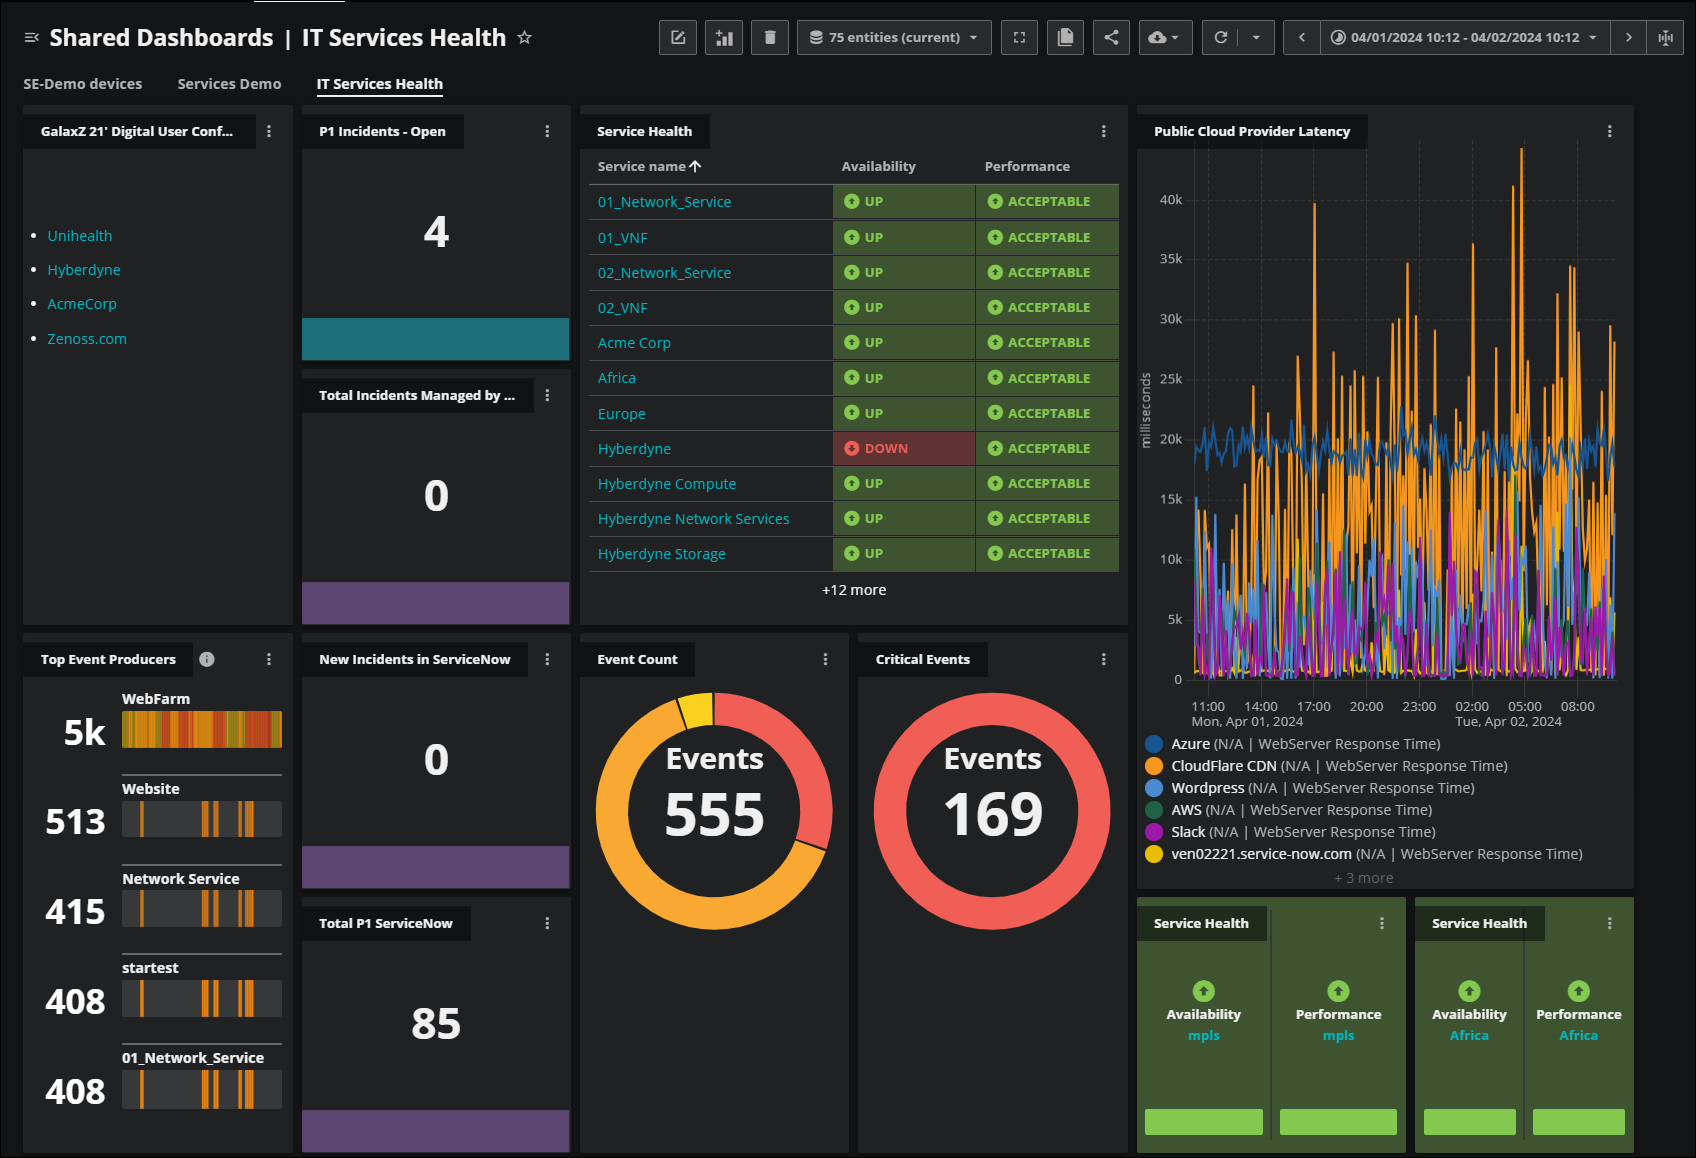
Each tile contains a visual representation of one or more performance or availability indicators.
- The color of an indicator reflects its state: neutral, positive or negative.
- You can resize and move tile as desired.
- A dashboard can have any number of tiles, so you may have to scroll to view additional tiles.
- Dashboards resize to accommodate browser geometry but are designed for use on computer monitors, not mobile devices.
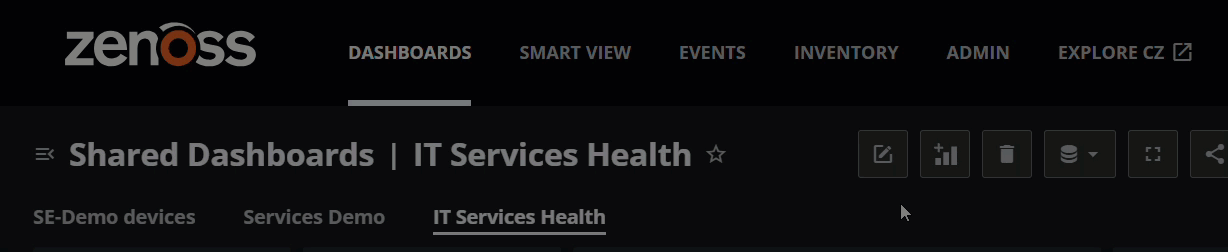
Dashboard header
In the dashboard header, you can view critical information and actions. If the action buttons are dimmed, check with your Virtana administrator about your permissions to edit a dashboard.
The window needs to be large enough to display all the action buttons easily. As the window shrinks, the header is truncated, but you can always access all the actions.

Viewing dashboards
You can open and view multiple dasboards in Virtana. To open a dashboard, use the Dashboards panel. The name of the currently selected dashboard and its source appear on the left side of the header.
If you want to change the name of the dashboard, hover your point over the name. Then, either click the name or the pencil icon and edit the name.
When you open multiple dashboards, the most recently opened dashboard tabs appear under the name of the currently open dashboard. Click on the tabs to change the focus.
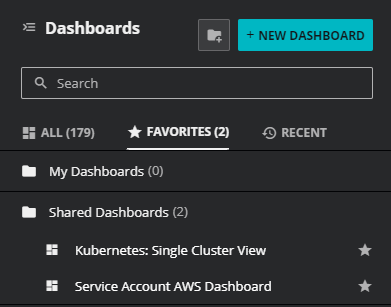
To mark a dashboard as a favorite, click the star icon beside the name. It will now appear in the Favorite tab of the Dashboards panel.
Dashboards panel
To open the dashboards panel, click the Dashboards menu button in the upper-left corner of the page.
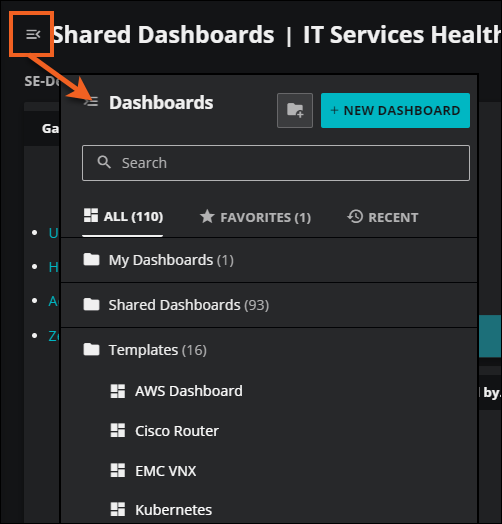
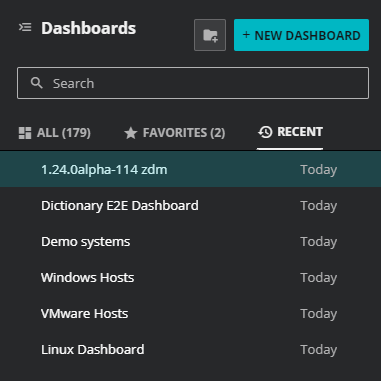
To display a different dashboard, click the name of one of your dashboards in the My Dashboards folder or open the Shared Dashboards folder and click the name of a shared dashboard. Also, you can click the FAVORITES or RECENT tabs to find dashboards that you marked as a favorite previously or displayed recently.
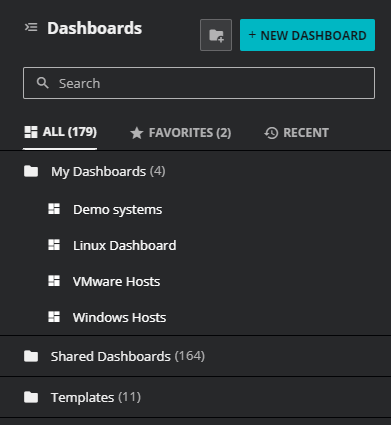
When you hover your pointer over a dashboard name, you can perform the following tasks:
- Click the star icon to mark the highlighted dashboard as a favorite.
-
Click the Actions (⋮) menu to select different options, such as editing, deleting, or sharing the dashboard, or setting it as your default user preference.

If your account includes the User or Manager role, the dashboard panel includes the Templates folder, which provides useful starting points for common dashboard scenarios.
You can display any shared dashboard, but you can only edit dashboards you own.
Panel folders
You can organize your dashboards by creating subfolders in your My Dashboards folder, which are mirrored in the Shared Dashboards folder.
In My Dashboards, click the folder icon next to the NEW DASHBOARD button.
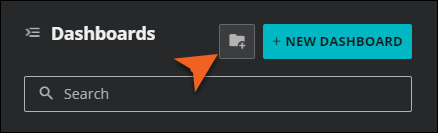
You can have two levels of subfolders. Use the vertical ellipsis (⋮) control on a subfolder to display the Add New Folder option.
Tip
As a best practice, use descriptive dashboard titles to avoid duplicate folder names.
Toolbar
The toolbar provides a variety of actions, including adding tiles, setting and filtering entity scope, setting the refresh interval, and more.
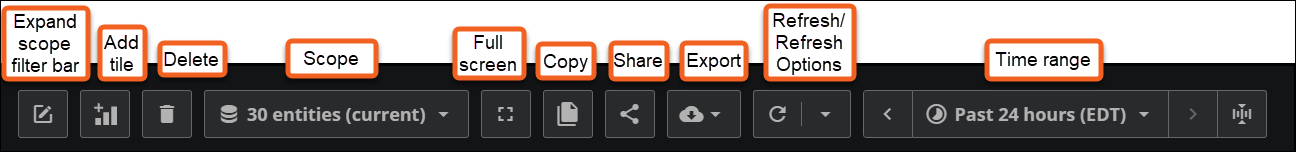
| Action | Description |
|---|---|
| Expand scope filter bar | Click to open a query builder, then create queries to refine the entities that you want to see. As you enter text, the scope filter bar suggests options for each part of the query, including property names, operators, values, and connectors. See Set dashboard scope filter for more information. |
| Add tile | Click to open the AVAILABLE TILES panel, then click a tile to add to your dashboard. When you add a tile, the TILE CONFIGURATION page opens. Each tile type has specific configuration settings and other options. To learn more about configuring a specific tile type, see the tile reference page. |
| Delete | Click to delete the dashboard. |
| Scope | Displays a description of the scope of entities in the dashboard. Click to open the Dashboard scope panel where you can switch between current and historical, and edit the scope. See Set dashboard scope. |
| Full screen | Click to expand the grid of tiles, which hides the header and footer. |
| Copy | Click to make a copy of the dashboard. |
| Share | Make the dashboard public if you are the owner, share it with selected users or user groups, or copy its URL to your clipboard, which you can then pass along. For more information, see Sharing dashboards. |
| Export | Download the dashboard data in CSV, JSON, or PDF format. See Export dashboard data. |
| Refresh now | Refresh the dashboard data. |
| Refresh options | Set a refresh interval. When you click Refresh options, the Dashboard Auto Refresh box opens. You can activate the auto refresh option and enter a refresh interval. Options include 1, 3, 5, and 10 minutes. |
| Time range controls | Use the time range settings to change the time range, the time zone, and to create custom time ranges for the quick-select panel. When you change the time range, Virtana Service Observability updates all the data on the page. See time range settings for more information. |
Tile actions
You can move and resize each tile on your dashboard, as well as perform other actions.
-
To move a tile to another location, hover your mouse in the tile header. When the mouse changes to the compass, you can click to grab the tile move it to a different location. The tile actions appear when you move your mouse anywhere over a tile.
-
To resize a tile, hover your mouse in the tile footer. When the resize icon appears in the bottom-right corner, click it to adjust the tile size.
The other actions are available in the Actions (⋮) menu in the tile header.
Tile actions menu
In the Actions (⋮) menu, you can perform tasks such as adjusting the view of the tile, editing and copying the tile, and accessing details about the tile.
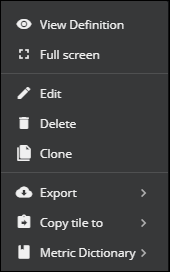
| Action | Description |
|---|---|
| View Definition | Opens a summary of the tile's settings. |
| Full screen | Enlarges an individual tile in your dashboard to fill the entire screen. This is useful when you want to examine tiles that contain extended details. When finished, click X to close the full screen and return to your dashboard. |
| Edit | Opens the tile configuration in full screen so you can adjust the settings, including adding filters to the tile. When finished, click SAVE, Cancel, or X to close the full screen and return to your dashboard. |
| Delete | Click to delete the tile from your dashboard. |
| Clone | Opens the tile configuration in full screen so you can clone the tile. You can select to change the tile title, adjust settings, or add options. When finished, click SAVE, Cancel, or X to close the full screen and return to your dashboard. |
| Export | Exports tile data |
| Copy tile to | Copies the tile to a new dashboard or an existing dashboard. This option is available for accounts with the User or Manager role. |
| Metric Dictionary | Opens the metric dictionary editor for the metric featured in the tile. This option is available when the metric featured in a tile has an entry in the metric dictionary. |
Creating new dashboards
Learn how to create a new dashboard.
Editing dashboards
To edit a dashboard, display a dashboard you own, and then use the dashboard controls to make changes to the dashboard as a whole, or use the tile controls to change individual tiles.
-
To edit a tile, click the pencil icon in the tile header.
-
To add a tile, click the add tile control, choose a tile from the AVAILABLE TILES palette, and then configure the tile.
-
To resize a tile, use the control in the bottom-right corner of the tile.
-
To move a tile, click anywhere in the tile header and then drag the tile to a new location.
For more information about configuring individual tiles, see the tile reference pages.
Sharing dashboards
Sharing is an easy way to give other users access to your dashboards. You can share a dashboard with all users or with a select group of users.
Learn how to share dashboards.
Working with dashboards
There are several useful tasks you can do to finetune and optimize your dashboards, including the following:
- Create a new dashboard
- Edit a dashboard
- Share a dashboard
- Export dashboard data
- Copy a dashboard template
Dashboard scope tasks:
Tile tasks: