Port Utilization
The report displays the total bandwidth broken down by LAN uplink, fiber channel uplink, appliance, and server ports.
Report filtering
The following fields filter the results.
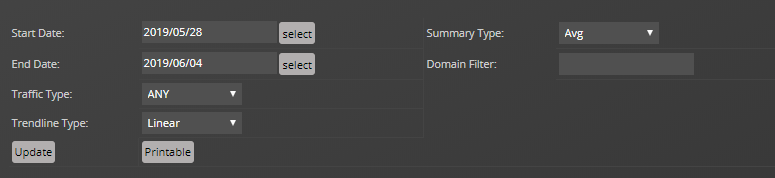
- Start Date / End Date
- The first and last dates of the range of dates to include in the report. To select a date from a calendar, click select. The default range is the week ending with the current date.
- Summary Type
- The type of summary that is to be displayed. Average is based on the 15-minute data collection, while Max is only taken once a day.
- Domain Filter
- A substring search of domains to include. A partial name matches all interface names that include it. You may also use a regular expression for this filter.
- Traffic Type
- Type of traffic to display. Choose from ANY, Tx or Rx.
- Trendline Type
- The calculation used to determine the trendline. Only available selection is Linear.
To generate or refresh the report, click Update.
The following is an example scenarios that may be seen in graphs along with its corresponding description:
- If the Server ports current value is 10G, then all the ports that have the Server port interface role are transmitting data at a combined rate of 10Gbps.
- If the LAN Uplink ports maximum value is 200M, then the ports connected from the Fabric Interconnect switch to the LAN network transfers data at 200Mbps.